Difference between revisions of "Graph control - DatLab"
From Bioblast
| (3 intermediate revisions by the same user not shown) | |||
| Line 5: | Line 5: | ||
| info= | | info= | ||
}} | }} | ||
__TOC__ | <!--__TOC__--> | ||
=== Mouse === | === Mouse === | ||
::; In the graph | ::; In the graph | ||
:::: Hold left mouse button: drag | :::: Hold left mouse button: drag all plots synchronously | ||
:::: Mouse wheel: scroll to zoom in and out | :::: Mouse wheel: scroll to zoom in and out | ||
::; On the axes | ::; On the axes | ||
| Line 19: | Line 18: | ||
::; Arrow keys | ::; Arrow keys | ||
:::: [[File:key_arrow_right.png|20px]] [[File:key_arrow_left.png|20px]] Right / left: navigate along the x-axis (time) | :::: [[File:key_arrow_right.png|20px]] [[File:key_arrow_left.png|20px]] Right / left: navigate along the x-axis (time) | ||
:::: [[File:key_arrow_up.png|20px]] [[File:key_arrow_down.png|20px]] move along the y-axis | :::: [[File:key_arrow_up.png|20px]] [[File:key_arrow_down.png|20px]] move along the y-axis of the data activated on the right hand side (y1 or y1-axis). | ||
::; Page up/down keys | ::; Page up/down keys | ||
:::: [[File:key_page_up.png|20px]] [[File:key_page_down.png|20px]] switch between graphs | :::: [[File:key_page_up.png|20px]] [[File:key_page_down.png|20px]] switch between graphs | ||
=== Graph | === Graph control buttons === | ||
:::: [[File:DL8_graph_option_symbols.png|none|200px|Graph option symbols]] | :::: [[File:DL8_graph_option_symbols.png|none|200px|Graph option symbols]] | ||
:::: Can be found at the right top of each graph | :::: Can be found at the right top of each graph | ||
:::: Find explanations by hovering above the symbols with the mouse. | :::: Find explanations by hovering above the symbols with the mouse pointer. | ||
=== 'Alt'-key === | === 'Alt'-key === | ||
| Line 39: | Line 38: | ||
}} | }} | ||
[[Category:DatLab 8 | [[Category:DatLab 8]] | ||
Latest revision as of 13:04, 24 March 2022


![]()
![]()
![]()
 |
Graph control - DatLab |

MitoPedia O2k and high-resolution respirometry:
O2k-Open Support
Description
A combination of mouse and keyboard commands provides convenient control of graphs in DatLab 8.
Mouse
- In the graph
-
- Hold left mouse button: drag all plots synchronously
- Mouse wheel: scroll to zoom in and out
- On the axes
-
- Hold left mouse button: move each axis individually
- Mouse wheel: scroll to change scaling, zooming in and out
Keyboard
- Arrow keys
-

 Right / left: navigate along the x-axis (time)
 move along the y-axis of the data activated on the right hand side (y1 or y1-axis).
- Page up/down keys
-

 switch between graphs
Graph control buttons
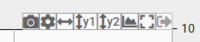
- Can be found at the right top of each graph
- Find explanations by hovering above the symbols with the mouse pointer.
'Alt'-key
 ... serves as a modifier for local versus global
- Mouse, keyboard and control buttons apply to the active graph, they have 'local' effect, while pressing the 'Alt'-key they effect all graphs in a 'global' manner.
- With the 'Alt'-key pressed, the x-axes of all graphs will change synchronously. Effects of control buttons will apply to all graphs, not only the active one.
MitoPedia O2k and high-resolution respirometry:
DatLab