Description
A healthy reference population, HRP, of zero underweight or overweight is considered as a standard population. The WHO Child Growth Standards on height and body mass are based on large samples in longitudinal (N=1737 children) and cross-sectional studies (N=6669) with similar numbers of girls and boys from Brazil, Ghana, India, Norway, Oman and the USA (1997-2003). Anthropometric studies carried out on adults since the 1960ies are prone to reflect the impact of high-caloric nutrition on allometric relationships, referring us to earlier time points for a HRP. The Committee on Biological Handbooks compiled a large dataset on height and body-mass of healthy males from infancy to old age (CBH dataset, N=17523; Zucker 1962). The original studies were published between 1931 and 1944 and thus apply to a population (USA) before emergence of the fast-food and soft drink epidemic, and with a lifestyle demanding a balanced physical activity without the impact of local war or economic disaster on starvation.
Abbreviation: HRP
Reference: Body mass excess
From BMI to BME
Four allometric phases
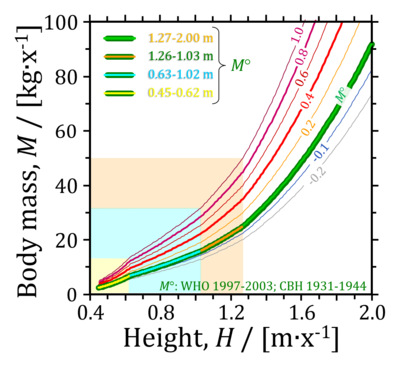
- The HRP is characterized by three allometric phases in childhood to early adolescence (up to 1.26 m height), and a final phase with an exponent of 2.867 (=1/0.35) >1.26 m, equal in women and men (Fig. 1; green line).
- Figure 1: Four phases of the allometric relationship between body mass, M°, and height, H, in the healthy reference population (HRP), and shift of M at body mass excess, BME, indicating underweight (BME = 0.8 and 0.9) or overweight (BME = 1.2) and increasing degrees of obesity (1.4 to 2.0). Compared to the HRP, the body mass index, BMI, assumes a more shallow increase of M° with H, hence a BMI of 20 indicates overweight (1.2M°) at 1.38 m, but underweight (0.9M°) at 1.92 m.
Personalized BMI-cutoffs
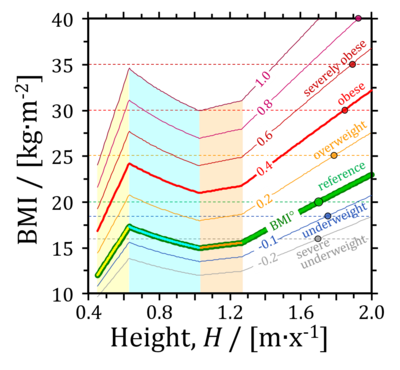
- Figure 2: Comparison of fixed BMI-cutoffs (dashed horizonal lines at BMI 18.5, 20, 25, 30 and 35) and personalized BMI-cutoffs, BMIx, as a function of height in the four phases of the allometric relationship. The personalized BMI-cutoffs are related to the reference body mass, M°, of the healthy reference population (HRP), and body mass excess, BME, from 0.8 to 2.0 (the numbers indicate the personalized BMI-cutoff lines).
- The fixed BMI-cutoffs at BMI 18.5 kg·m-2 for underweight, or 25 and 30 kg·m-2 for overweight and obese, do not support a general categorization from children to adults, for women and men, or different ethnic groups. The BME-concept resolves these limitations, with BME-cutoffs at 0.9 for underweight, or 1.2 and 1.4 for overweight and obese for a large range of ethnic groups including white Caucasians, Black Americans and Asians (Inuit are an exception). Differences in height between Caucasians and Asians explain the limitations of fixes BMI-cutoffs. The BME-concept rationalizes the necessary adjustments in the BMI-cutoffs for Asians, and thus presents personalized BMI-cutoffs (Fig. 2).
References
- WHO Multicentre Growth Reference Study Group (2006) WHO child growth standards based on length/height, weight and age. Acta Pædiatrica Suppl 450:76-85. - »Bioblast link«
- WHO Multicentre Growth Reference Study Group (2006) WHO child growth standards: length/height-for-age, weight-for-age, weight-for-length, weight-for-height and body mass index-for-age: Methods and development. Geneva: World Health Organization:312 pp. - »Bioblast link«
- Zucker TF (1962) Regression of standing and sitting weights on body weight: man. In: Altman PL, Dittmer DS, eds: Growth including reproduction and morphological development. Committee on Biological Handbooks, Fed Amer Soc Exp Biol:336-7. – Anthropometry, H and M°, of the healthy reference population, HRP; based on [3.1-3.5]. - »Bioblast link«
- Bayley N, Davis FC (1935) Growth changes in bodily size and proportions during the first three years. Biometrika 27:26-87.
- Gray H, Ayres JG (1931) Growth in private school children. Behavior Res Fund Monog, Univ Chicago Press, Chicago:282 pp. – With averages and variabilities based on 3110 measurings on boys and 1473 on girls from the ages of one to nineteen years.
- Meredith HV (1935) Univ Iowa studies in child welfare 11(3).
- Peatman JG, Higgons RA (1938) Growth norms from birth to the age of five years: a study of children reared with optimal pediatric and home care. Am J Diseases Children 55:1233-1247.
- Simmons KW (1944) Monographs Soc Research in Child Develop 9(1).
- Body mass excess
MitoPedia concepts:
MiP concept
Labels:
MitoPedia:BME


