

![]()
![]()
![]()
 |
MitoPedia: DatLab |

MitoPedia O2k and high-resolution respirometry:
O2k-Open Support
- Welcome at MitoPedia: DatLab. Here you find Oroboros support for DatLab and the O2k.
List of DatLab menus
![]()
DatLab installation

File
- » Open
- » Close
- » Save
- » Save and disconnect
- » Save as
- » File search
- » Delete
- » Import DatLab templates DatLab templates
- » Export
- Export DL-Protocol User (*.DLPU)
- Data to text file: Text file
- Export - Events to text file: Text file
- Export - One channel to DatLab 2 analysis: DatLab 2
- » Change user: User
- » Manage users: User

Oroboros O2k
- » O2k configuration
- » O2k channel labels
- » O2k control
- » Stirrer A on/off
- » Stirrer B on/off
- » Stirrer test
- » Illumination on/off
- » Manage setups: Manage setups and templates

TIP2k
- » TIP2k control: Titration-Injection microPump
- » Manage setups: Manage setups and templates

Protocol

Experiment
- » Sample: Sample
- » Exp. log: Experimental log
- » Add event: Events

Calibration
- » O2: O2 calibration
- » Amp: Amp calibration
- » pX: pX calibration

Flux / Slope
- » O2: Flux / Slope
- » Amp: Flux / Slope
- » pX: Flux / Slope
- » Proton Flux / Slope

Graph
- » Add graph/Delete bottom graph: Add/Delete
- » Select plots: Select plots - DatLab
- » Scaling: Scaling - DatLab
- » Info: Graph / Info
- » Synchronous time axes
- » Autoscale
- » Mouse control: Mark and Zoom
- » Full screen
- » Display numerical value
- » Display Power-O2k
- » Options: Graph options
- » Copy to clipboard

Layout
- » Info / Load / Save: Layout: Info/ Load/ Safe
- » Standard layouts - O2k-FluoRespirometer: Standard layouts - O2k-FluoRespirometer
- » Lab layouts: Lab layouts
- » User: Name: User: Name

Marks
- » Edit mark information: Marks
- » Statistics: Mark statistics
- » Manage mark stat. templates: Manage setups and templates
- » Specifications: Mark specifications
- » Manage mark specifications templates: Manage setups and templates
- » Copy marks
DatLab glossary
| Term | Abbreviation | Description |
|---|---|---|
| Add Graph/Delete bottom graph | Add: A new graph is added at the bottom of the screen. Select plots for display in the new graph, Ctrl+F6. Delete: Delete one of the graphs displayed in DatLab. | |
| Air calibration | R1 | Air calibration of an oxygen sensor (polarographic oxygen sensor) is performed routinely on any day before starting a respirometric experiment. The volume fraction of oxygen in dry air is constant. An aqueous solution in equilibrium with air has the same partial pressure as that in water vapour saturated air. The water vapour is a function of temperature only. The partial oxygen pressure in aqueous solution in equilibrium with air is, therefore, a function of total barometric pressure and temperature. Bubbling an aqueous solution with air generates deviations from barometric pressure within small gas bubbles and is, therefore, not recommended. To equilibrate an aqueous solution ata known partial pressure of oxygen [kPa], the aqueous solution is stirred rigorously in a chamber enclosing air at constant temperature. The concentration of oxygen, cO2 [µM], is obtained at any partial pressure by multiplying the partial pressure by the oxygen solubility, SO2 [µM/kPa]. SO2 is a function of temperature and composition of the salt solution, and is thus a function of the experimental medium. The solubility factor of the medium, FM, expresses the oxygen solubility relative to pure water at any experimental temperature. FM is 0.89 in serum (37 °C) and 0.92 in MiR06 or MiR05 (30 °C and 37 °C). |
| Amp calibration - DatLab | F5 | Amp calibration indicates the calibration of the amperometric O2k-channel. |
| Amperometric,Amp | F7 | After selection of the Amperometric, Amp channel in the O2k configuration, an Amperometric, Amp tab will appear in the O2k control [F7] window. Set the desired light intensity (0-1600) in the field ´Fluo intensity´ and the desired amplification of the signal (1-1000) in the field ´Gain for Fluo sensor´in the Amperometric, Amp window followed by a left-click Send to O2k. Switching off the illumination before each fluorometric measurement is routinely required. |
| Automatic pan - DatLab | Automatic pan (only for real-time data recording) toggles automatic panning on/off by clicking in the O2k status line. If it is on (green), the time range is maintained while the time axis always shows the currently recorded data, i.e. the value of the offset (minimum value) increases as experimental time proceeds. If it is off (yellow), the time axis is static. This allows for manually panning backwards to observe previous sections of the experiment at a given time range. In this mode, the actual experimental time may be off-scale. Toggle between "Pan auto" and "Pan off" by a left-click on the text. It does not influence continuous data recording. It is recommended to maintain automatic panning on during the experiment, except for specifically viewing earlier sections of the experiment. | |
| Autoscale | Autoscale zooms in or out of the selected period with Autoscale time axis, Autoscale Y1 (Y2) axes and Automatic pan. | |
| Autoscale Y1 (Y2) axes | Autoscale Y1 (Y2) axes: Autoscaling the measured values (full data range) on the Y1 (Y2) axis in the selected plot. | |
| Autoscale time axis | Autoscale time axis gives an overview of the entire experimental period. | |
| Barometric pressure | pb [Pa] | Barometric pressure, pb, is an important variable measured for calibration of oxygen sensors in solutions equilibrated with air. The atm-standard pressure (1 atm = 760 mmHg = 101.325 kPa) has been replaced by the SI standard pressure of 100 kPa. The partial pressure of oxygen, pO2, in air is a function of barometric pressure, which changes with altitude and locally with weather conditions. The partial oxygen pressure declines by 12 % to 14 % per 1,000 m up to 6,000 m altitude, and by 15 % to 17 % per 1,000 m between 6,000 and 9,000 m altitude. The O2k-Barometric Pressure Transducer is built into the Oroboros O2k as a basis for accurate air calibrations in high-resolution respirometry. For highest-level accuracy of calculation of oxygen pressure, it is recommended to compare at regular intervals the barometric pressure recording provided by the O2k with a calibrated barometric pressure recording at an identical time point and identical altitude. The concept of gas pressure or barometric pressure can be related to the generalized concept of isomorphic pressure. |
| Block temperature | The block temperature of the Oroboros O2k is the continuously measured temperature of the copper block, housing the two glass chambers of the O2k. The block temperature is recorded by DatLab as one of the O2k system channels. | |
| Cell count and normalization in HRR | Nce | The cell count Nce is the number of cells, expressed in the abstract unit [x] (1 Mx = 106 x). The elementary entity cell Uce [x] is the real unit, the 'single individual cell'. A cell count is the multitude or number N of cells, Nce = N·Uce (Gnaiger MitoFit Preprints 2020.4). Normalization of respiratory rate by cell count yields oxygen flow IO2 expressed in units [amol·s-1·x-1] (=10-18 mol·s-1·x-1). |
| Chamber volume | The chamber volume of the O2k is 2.0 mL or 0.5 mL of aqueous medium with or without sample, excluding the volume of the stirrer and the volume of the capillary of the stopper (see: Cell count and normalization in HRR). A modular extension of the O2k, the O2k-sV-Module, was specifically developed to perform high-resolution respirometry with reduced amounts of biological sample, and all components necessary for the smaller operation volume of 0.5 mL. | |
| Channel | F7 | » See O2k signals and output |
| Check for updates - DatLab | Check for updates in the Help pull-down menu of DatLab 8 and follow the simple installation instruction if your computer (Linux or Windows) running DatLab is connected to the internet. Alternatively, use a different computer connected to the internet, download the update for Linux, and transfer it to the computer operating DatLab by USB. Check regularly for updates. | |
| Close and delete file - DatLab | Close and delete file. The decision to delete a DatLab file containing no useful data can be made most easily when viewing the traces. Only available when disconnected from the O2k. | |
| Connect to O2k | Connect to O2k connects DatLab with the O2k. Select the USB port (or Serial port) with the corresponding cable connecting your PC to the O2k. Select the subdirectory for saving the DLD file. Then data recording starts with experimental time set at zero. | |
| Connection window | After starting DatLab either the Connection window opens automatically by default or open O2k control by pressing [F7] and select the communication port. | |
| Copy marks | In Copy marks, Marks in DatLab are copied from a seleted Plot to the active plot. | |
| Copy marks - DatLab | ||
| Copy to clipboard | In DatLab Copy to clipboard can be used to copy selected graphs or values and to paste them to your preferred program or file (e.g. Word, Excel). | |
| Custom label | A Custom label can be entered in this box to rename the axis label. Two lines are available for the axis name and unit. | |
| Cyclic voltammetry - DatLab | Cyclic voltammetry | |
| DatLab |  The newest DatLab version is DatLab 8, included in the O2k-Packages. NextGen-O2k and O2k-Series J* and higher come with DatLab 8 installed on the integrated PC (Linux). DatLab 8 is required for the NextGen-O2k. DatLab 8.1 is compatible with O2k-Series (E and higher). The DatLab software is designed for 64-bit versions of Windows operating systems and does not run on MAC devices. The minimum computer requirements are Intel-Core-2 or equivalent CPU, 2GB RAM and Windows XP (64-bit version). However, we recommend Intel i5 or equivalent CPU, 4GB RAM, Windows 10 (64-bit version) and SSD. For the proper display of DatLab on your computer, please make sure the “Language settings” are set to English. *Optionally available without integrated PC. | |
| DatLab 2 | DL2 | DatLab 2 (DL2) is a MS-DOS programe. DL2 is still used for analysis of oxygen kinetics, after exporting files recorded in recent DatLab versions. A user-friendly O2-kinetics module is in preparation (DL8). |
| DatLab data file | dld8, DLD | DatLab 8: The file type generated is *.dld8. DatLab 7: The file type generated is *.DLD. |
| DatLab error messages | Common DatLab error messages and according actions and solutions are listed here. | |
| DatLab installation | ||
| DatLab oxygen flux: performance and data analysis | The quality of the results are strongly affected by the performance and data analysis. Therefore, we provide guidelines for performing and evaluating respirometric assays. | |
| DatLab templates | DatLab templates can be imported for O2k-setups, graph layouts, mark names, TIP2k setups and marks statistics configurations.
| |
| DatLab-Analysis templates | Go in DatLab to Mark statistics (F2), select which type of marks you want to export ("All marks in plot" or "DL-Protocol marks", with 3 possibilities each), then click on [Copy to clipboard] to copy selected values and paste them to a DatLab-Analysis template for numerical and graphical data analysis. | |
| Data labels and units - DatLab | ||
| Data masks - DatLab | ||
| Data recording interval | F7 | The data recording interval is the time interval at which data is sampled with an instrument. In DatLab the data recording interval is set in the O2k control window. The system default value is 2 s. A lower data recording interval is selected for kinetic experiments, and when the volume-specific oxygen flux is high (>300 pmol O2·s-1·ml-1). Technically, the O2k instrument (hardware) measures the sensor signal every 10ms (which is NOT the „data recording interval“). By the given data recording interval from DatLab (software) a discrete number of sensor signal points are taken to calculate an average value in the O2k (e.g. a data recording interval of 2 s can take 200 sensor signal points; a data recording interval of 0.5 s can take 50 sensor signal points). This average value is sent to DatLab and is recorded as a raw data point. However, there is a defined threshold: the O2k does not apply more than 200 sensor signal points to calculate the average for the raw data point. For example a data recording interval of 3 s could take 300 sensor signal points but only the 200 most recent sensor signal points are used for averaging. |
| Default label | The Default label is the system default value for the axis label. These labels are changed automatically, according to the selected channel and unit. To change this label enter a Custom label. | |
| Delete points | Select Delete points in the Mark information window to remove all data points in the marked section of the active plot. See also Interpolate points and Restore points or Recalculate slope. | |
| Deselect channels | F7 | Channels can be selected/deselected in DatLab in the O2k configuration. Deselect all O2k-MultiSensor channels in O2k-Core applications. Select only the specifically used channels in O2k-MultiSensor applications. |
| Display DatLab help | Display DatLab help
In this section, we present some issues that could happen during your data analysis related to the graphs display and how to fix them quickly. Case in which an issue might occur:
In the event of a frozen display of the graphs, try the alternatives below:
| |
| Display Power-O2k | The Power-O2k number, which is set in the pull-down menu Oroboros O2k \ O2k configuration, is shown in the active graph. To show it in graphs copied to clipboard, the option "Show Oroboros icon in clipboard files" must be enabled in the Graph-menu Graph options - DatLab. | |
| Display numerical value | If Display numerical value the current numerical values are displayed in the graph for the active plots on the Y1 axis and Y2 axis (during data acquisition only). | |
| Enable DL-Protocol editing | Enable DL-Protocol editing is a novel function of DatLab 7.4 offering a new feature in DL-Protocols: flexibility. Fixed sequences of events and marks can be changed (Skip/Added) in a SUIT protocol by the user. Moreover, the text, instructions, concentrations and titration volumes of injections in a specific DL-Protocol can be edited and saved as user-specific DL-Protocol [File]\Export\DL-Protocol User (*.DLPU). To enable it, under the 'Protocols' tab in the menu, select the option 'Enable DL-Protocol editing', and then select the plot in which the marks will be set (e.g., O2 flux per V). Select the 'Overview' window, where you will be able to edit events and marks names, definition/state, final concentration and titration volumes, as well as select a mark as 'multi' for multiple titration steps, skip a mark, or add a new event or mark. After saving, export a DL-Protocol User (DLPU) and load it before running the next experiments. If users of DatLab versions older than DatLab 7.4 wish to alter the nature of the chemicals used or the sequence of injections, we ask them to contact the O2k-Technical Support.
For more information:  Export DL-Protocol User (*.DLPU) Export DL-Protocol User (*.DLPU) | |
| Events - DatLab | F4 | An event in DatLab is a defined point in time, labelled by a name (1 to 10 characters). An event applies to all plots of the selected O2k-Chamber. The event is shown by a vertical line in the graph and the label of the event is shown on the top (DatLab 6 and lower: on the bottom). The default name is the sequential number of the event. It is recommended to edit event labels with a minimum number of characters, and to explain the abbreviation in the 'Definition' box. The final concentration and titration volume can be entered into the corresponding boxes, if the event relates to the titration of a substance. A short comment can be entered to describe the event in detail.
Set events - Manual events are entered (real-time, connected to the O2k) by pressing [F4] at the time of the event (e.g. to indicate a manual titration into the chamber). An event belongs either to chamber A, chamber B, or both. Instrumental events are added automatically, e.g. when the stirrer (A or B) or illumination (both chambers) is switched on or off. After setting a new event the Edit event window pops up. Pressing F4 defines the time point of the event. Full attention can then be paid to the experiment. Edit the event later, as it is possible to insert an event at any chosen moment of the plotted record of the experiment by placing the cursor anywhere in the graph at the selected time point by pressing Ctrl and clicking the left mouse button. Edit event - Left click on the name of an existing event to open the Edit event window to edit or Delete event. In events obtained from a selected protocol, the entire sequence of consecutive events is defined with event names, definitions, concentrations and titration volumes. Name - Enter an event name of 1 to 10 characters. Short names (e.g. O instead of Open) are recommended. Comment - Further information can be entered into the text field. Select O2k-chamber A, B or both. The Event will be shown on plots for both or one selected chamber. »Protocol events |
| Experimental code | F3 | An experimental code can be entered in the Sample window, containing up to 10 digits. |
| Experimental log - DatLab | Ctrl+F3 | Experimental log provides an automatically generated experimental protocol with detailed information about the O2k settings and calibrations, the Sample information and various Events. Time-dependent information can be viewed for a single chamber or both chambers. The filter can be selected for viewing minimum information, intermittent by default, or all information. The experimental log can be viewed and saved as a PDF file by clicking on [Preview]. |
| Export DL-Protocol User (*.DLPU) | it is a function of DatLab (available from version 7.4 onwards) that enables the export of user specific protocols (DL-Protocol User) to the SUIT protocol folder from which they can be uploaded for subsequent measurements. | |
| Export as CSV - DatLab | Ctrl-E | Export as CSV (*.csv) exports plots and events to a text file for further use in Excel and other programs. |
| File search - DatLab | Ctrl+F | File search yields a list of all files labelled by the experimental code in a selected directory . Click on the file to preview the experimental log. With File Search you can search in all folders and subfolders on your computer for DatLab files with a selected experimental code. The experimental code is entered in the DatLab file in the window "Experiment" ([F3]). When you click on a folder and press the button search, the DatLab file names will appear on the right window. Click on a DatLab file and further information (e.g. Sample information, Background information) will appear in the window below. |
| Fluo calibration - DatLab | ||
| Flux / Slope | J | Flux / Slope is the time derivative of the signal. In DatLab, Flux / Slope is the name of the pull-down menu for (1) normalization of flux (chamber volume-specific flux, sample-specific flux or flow, or flux control ratios), (2) flux baseline correction, (3) Instrumental background oxygen flux, and (4) flux smoothing, selection of the scaling factor, and stoichiometric normalization using a stoichiometric coefficient. Before changing the normalization of flux from volume-specific flux to sample-specific flux or flow, or flux control ratios, please be sure to use the standard Layout 04a (Flux per volume) or 04b (Flux per volume overlay). When starting with the instrumental standard Layouts 1-3, which display the O2 slope negative, the sample-specific flux or flow, or flux control ratios will not be automatically background corrected. To obtain the background corrected specific flux or flux control ratios, it is needed to tick the background correction in the lower part of the slope configuration window. Background correction is especially critical when performing measurements in a high oxygen regime or using samples with a low respiratory flux or flow. |
| Flux analysis - DatLab | The strategy of Flux analysis using DatLab depends on the research question and the corresponding settings applied in DatLab when recording the data with the O2k. Usng SUIT protocols, a sequence of respiratory steady-states is measured, marks are set, and numerical data are summarized in Mark statistics (F2). An AI approach is kept in mind when describing guidelines for evaluation of steady-states during data recording and analysis. | |
| Flux baseline correction | bc | Flux baseline correction provides the option to display the plot and all values of the flux (or flow, or flux control ratio) as the total flux, J, minus a baseline flux, J0.
JV(bc) = JV - JV0
JV = (dc/dt) · ν-1 · SF - J°V
For the oxygen channel, JV is O2 flux per volume [pmol/(s·ml)] (or volume-specific O2 flux), c is the oxygen concentration [nmol/ml = µmol/l = µM], dc/dt is the (positive) slope of oxygen concentration over time [nmol/(s · ml)], ν-1 = -1 is the stoichiometric coefficient for the reaction of oxygen consumption (oxygen is removed in the chemical reaction, thus the stoichiometric coefficient is negative, expressing oxygen flux as the negative slope), SF=1,000 is the scaling factor (converting units for the amount of oxygen from nmol to pmol), and J°V is the volume-specific background oxygen flux (Instrumental background oxygen flux). Further details: Flux / Slope. |
| Flux control ratio | FCR | Flux control ratios FCRs are ratios of oxygen flux in different respiratory control states, normalized for maximum flux in a common reference state, to obtain theoretical lower and upper limits of 0.0 and 1.0 (0 % and 100 %). For a given protocol or set of respiratory protocols, flux control ratios provide a fingerprint of coupling and substrate control independent of (1) mt-content in cells or tissues, (2) purification in preparations of isolated mitochondria, and (3) assay conditions for determination of tissue mass or mt-markers external to a respiratory protocol (CS, protein, stereology, etc.). FCR obtained from a single respirometric incubation with sequential titrations (sequential protocol; SUIT protocol) provide an internal normalization, expressing respiratory control independent of mitochondrial content and thus independent of a marker for mitochondrial amount. FCR obtained from separate (parallel) protocols depend on equal distribution of subsamples obtained from a homogenous mt-preparation or determination of a common mitochondrial marker. |
| Full screen | By clicking/enabling Full screen in the Graph-menu in DatLab the currently selected graph is shown alone on the full screen (On) or together with the other defined graphs (Off). Full screen is particularly useful for a single channel overview and for Copy to clipboard [ALT+G B]. | |
| Gain | The gain is an amplification factor applied to an input signal to increase the output signal. | |
| Getting started - DatLab | Users have to enter their user details the first time they use DatLab 8 on a specific computer. As well, entering some basic settings is required when connecting DatLab 8 with an O2k for the first time. | |
| Graph control - DatLab | A combination of mouse and keyboard commands provides convenient control of graphs in DatLab 8. | |
| Graph layout - DatLab | » See Layout for DatLab graphs. | |
| Graph options - DatLab | Several display options can be applied to a DatLab graph under Graph options. | |
| Illumination | F10 | The chambers of the Oroboros O2k are illuminated by an internal LED. The illumination is switched on and off in DatLab during the experiment by pressing [F10]. This illumination must be distinguished from light introduced into the chambers by LEDs for the purpose of spectrophotometric and fluorometric measurements. For these, the internal illumination must be switched off. |
| Illumination on/off | F10 | The illumination in both chambers is switched on/off. |
| Install Oroboros protocol package | The standard Instrumental and SUIT DL-Protocols package is automatically implemented with the simple DatLab programme installation. We recommend a 'clean install': rename your previous DatLab programme subdirectory (e.g. C:\DatLab_OLD). Updates and newly developed DL protocols can be simply downloaded by clicking on [Protocols]\Install Oroboros protocol package. | |
| Instrumental: Browse DL-Protocols and templates | Instrumental DL-Protocols (DLP) including DatLab example traces, instructions, brief explanatory texts, links to relevant pages and templates for data evaluation can be browsed from inside DatLab 7.4. Click on menu [Protocols]\Instrumental: Browse DL-Protocols and templates to open a folder with all the DL-Protocols and templates for cleaning, calibration, and background determination provided with the DatLab 7.4. Select a sub-directory and open an DL-Protocol and/or template as desired. | |
| Interpolate points | Select Interpolate points in the Mark information window to interpolate all data points in the marked section of the active graph. See also Delete points and Restore points or Recalculate slope. | |
| Keyboard shortcuts - DatLab | DatLab provides several keyboard shortcuts to allow for quick access to many functions and settings without using a mouse. | |
| Laboratory titration sheet | Laboratory titration sheet contains the sequential titrations in a specific Substrate-uncoupler-inhibitor titration (SUIT) protocol. The laboratory titration sheets for different SUIT protocols are incorporated in DatLab (DL7.1): Protocols in DatLab | |
| Layout for DatLab graphs | A Layout in DatLab selected in the Layout menu yields a standardized display of graphs and plots displayed with specific scalings. The graph layout defines initial settings, which can be modified for plots [Ctrl+F6] and scaling [F6]. A modified layout can be saved as user layout without changing the standard layouts. | |
| Lower O2 limit - DatLab | A Lower O2 limit [µM] can be defined for each O2k-chamber, to trigger an automatic warning when the experimental O2 concentration drops below this limit. It reminds the user that re-oxygenation of the O2k-chamber may be required. For the lower O2 concentration limit, the critical oxygen concentration should be considered, which differs between isolated mitochondria, large cells, and permeabilized muscle fibers. A higher limit should be chosen when high oxygen flux is expected, e.g. prior to uncoupler titration. A lower limit is acceptable prior to inhibition of respiration causing low oxygen flux. | |
| Manage setups and templates - DatLab | Setups and templates in DatLab can be renamed or deleted under Manage setups or Manage templates. | |
| Mark information | Marks | » See Marks - DatLab |
| Mark specifications - DatLab | The function Mark specifications is largely replaced by SUIT DL-Protocols and Instrumental DL-Protocols in DatLab 7.4. Mark specifications allow the user to rename Marks in the active plot and save/recall the settings. Rename marks individually by clicking into the horizontal bar, or use corresponding templates for renaming the entire sequence of marks. | |
| Mark statistics - DatLab | F2 | In Mark statistics one Plot is selected as a source for Marks over sections of time. Values (e.g. medians) are displayed for these time sections of the source plot and of all selected plots. |
| Marks - DatLab | Marks in DatLab define sections of a plot recorded over time. Marks are set by the user in real-time, or post-experimentally for basic level data analysis. Set Marks to obtain the median, average, standard deviation, outlier index and range of the data within the mark, for calibration of the oxygen signal, flux analysis, or to delete marked data points. Marks are shown by a horizontal bar in the active plot. The default Mark names are given automatically in numerical sequence, independent for each plot. Rename marks individually by clicking into the horizontal bar, or use corresponding templates for renaming the entire sequence of marks. Several marks can be set on any plot. | |
| Mouse control: Mark | Ctrl+M | The mark mode is active by default, can be selected in the menu or by [Ctrl+M]. If Mouse control: Mark is enabled, specific sections of the experiment can be marked in each plot.
Usually, marks are set on the plot for oxygen concentration for calibration, whereas marks on the plot for oxygen flux are set for exporting the median or average of flux to a table. »More details: Marks - DatLab. |
| Mouse control: Zoom | Ctrl+Z | Select Mouse Control: Zoom in the Graph-menu or press [Ctrl+Z]. |
| NADH calibration - DatLab | NADH calibration | |
| Normalization of rate | Normalization of rate (respiratory rate, rate of hydrogen peroxide production, growth rate) is required to report experimental data. Normalization of rates leads to a diversity of formats. Normalization is guided by physicochemical principles, methodological considerations, and conceptual strategies. The challenges of measuring respiratory rate are matched by those of normalization. Normalization of rates for: (1) the number of objects (cells, organisms); (2) the volume or mass of the experimental sample; and (3) the concentration of mitochondrial markers in the instrumental chamber are sample-specific normalizations, which are distinguished from system-specific normalization for the volume of the instrumental chamber (the measuring system). Metabolic flow, I, per countable object increases as the size of the object is increased. This confounding factor is eliminated by expressing rate as sample-mass specific or sample-volume specific flux, J. Flow is an extensive quantity, whereas flux is a specific quantity. If the aim is to find differences in mitochondrial function independent of mitochondrial density, then normalization to a mitochondrial marker is imperative. Flux control ratios and flux control efficiencies are based on internal normalization for rate in a reference state, are independent of externally measured markers and, therefore, are statistically robust. | |
| O2 background correction - DatLab | ||
| O2k chamber volume calibration | The O2k-chamber volume calibration has to be done before getting started with the Oroboros O2k to guarantee a standard chamber volume of 2.0 mL. | |
| O2k channel labels | Default channel labels can now be changed, and new labels set by the user. E.g., rename the Amperometric channel, Amp, to 'H2O2' for H2O2 measurements by fluorometry; rename the potentiometric channel, pX, to TPP+ for mitochondrial membrane measurements with the O2k-pH ISE-Module. For changing the label, go to menu [Oroboros O2k]\O2k channel labels and set the new channel label as desired. | |
| O2k configuration | Configure or modify the settings for the O2k sensors In O2k configuration, channels (amperometric and potentiometric) can be switched on/off by selecting the according tick box. The Power-O2k number (P1, P2, ..) and numbers for O2 sensors, Amp sensors, pX electrodes and pX reference electrodes are entered or edited here. With the O2k-FluoRespirometer (O2k-Series H and higher), the serial numbers of the Smart Fluo-Sensors are shown automatically under [Amperometric, Amp]. The O2k configuration window pops up when DatLab starts and "Connect to O2k" is pressed for the first time. It is also accessible from the menu "Oroboros O2k" and from within the O2k control and Mark statistics windows. | |
| O2k control | F7 | After selection of an O2k setup in the O2k control [F7] window, followed by a left-click Send to O2k, only the following control functions are routinely required during experimental operations. |
| O2k control panel - DatLab | The O2k control panel allows for quick access of O2k instrument settings. It covers the right side of the graphical user interface of DatLab 8. If a DatLab protocol is active, the protocol panel ist shown instead, a tab at the right side allows to switch between O2k control panel and protocol panel. | |
| O2k series |  | |
| O2k signal line | The O2k signal line is underneath the O2k status line. It shows, depending on the O2k series, on the left side the O2k number, the time of the experiment, the oxygen raw signal of each chamber, the block temperature, the barometric pressure, the Peltier power, the recorded amperometric and potentiometric raw signal, the enviromental (room) temperature and the signal from internal sensors recording the humidity and temperature of the electronics. On the right side of the O2k signal line the current user, the DatLab version and the O2k serial number are displayed. | |
| O2k signals and output | Three electronic channel types are available in the O2k-MultiSensor system. All channels are available twofold (dual-data), for O2k-Chambers A (left) and B (right), based on numerical signals sent at a fixed data sampling time interval (default: 2 s; range 0.2 s to >10 s). | |
| O2k status line | O2k status line is found above the O2k signal line. It contains information about the chamber label, O2 calibration, amperometric calibration, potentiometric calibration, the block temperature, the illumination in chambers, the TIP2k status and the Automatic pan. | |
| Open - DatLab | Ctrl+O | Open a previously recorded DatLab file. |
| Oroboros USB-flash drive | The Oroboros USB-flash drive is delivered with the Oroboros O2k. Copy the folder "Oroboros O2k-Course on HRR" from the Oroboros USB-flash drive to your computer. This folder contains the DatLab installation program as well as tools to find topics, O2k-manuals and O2k-protocols with corresponding DatLab demo files and templates for training with DatLab. | |
| Outlier index threshold - DatLab | ||
| Outlier-skewness index | OSI, OI | An outlier-skewness index OSI is defined for evaluation of the distribution of data sets with outliers including separate clusters or skewness in relation to a normal distribution with equivalence of the average and median. The OSI is derived from Pearson’s coefficient of skewness 2:
The outlier-skewness index OSI introduces the absolute value of the arithmetic mean, m = ABS(average + median)/2, for normalization:
|
| Overlay of plots - DatLab | Overlay of plots is defined in DatLab as selection of graph layouts showing identical plots from the two O2k-chambers in each graph. Overlay of plots is selected in Graph layout. Superimposed traces of flux/flow from chambers A and B are then shown in Graph 1, and of concentration in chambers A and B in Graph 2.
There are basically two ways to superimpose traces recorded in different experiments: Export of the graphics via windows metafile or export of the data to e.g. a spreadsheet program. If you export via wmf you also can manipulate the graphics but then usually the lines are broken up in different segments. This can be done in various programs like MS Word, Open Office Draw and even in MSPower Point, though this maybe is the worst program to do this. It is better to manipulate them in a proper program like OO Draw, convert it to an unchangeable picture and then import it to a presentation graphics. Anyway, when you import directly to Power point (or other programs), make sure not to import it as a "picture" but as a metafile. Also in some programs you might afterwards have to "break" it up, or accept a "conversion to a MS Draw object" or other similar linguistic inventions of the software gurus. For this option we suggest to do as much as possible directly in DatLab (setting colors, line widths, ..) using the options in "Plots"/"select plots" and "graph"/"options". The “hardcore“ option is to export the data and import it into e.g. a spreadsheet program (MS Excel , OOCalc). It takes longer to have a simple overlay but gives you far less problems later and its easier to make changes later. To do this you can export your dataset "Export"/"Data to Textfile" and then go from there. | |
| Oxygen calibration - DatLab | O2 calibration is the calibration in DatLab of the oxygen sensor. It is a prerequisite for obtaining accurate measurements of respiration. Accurate calibration of the oxygen sensor depends on (1) equilibration of the incubation medium with air oxygen partial pressure at the temperature defined by the experimenter; (2) zero oxygen calibration; (3) high stability of the POS signal tested for sufficiently long periods of time; (4) linearity of signal output with oxygen pressure in the range between oxygen saturation and zero oxygen pressure; and (5) accurate oxygen solubility for aqueous solutions for the conversion of partial oxygen pressure into oxygen concentration. The standard oxygen calibration procedure is described below for high-resolution respirometry with the calibration routine using instrumental calibration DL-Protocols in DatLab. | |
| Oxygen flow | IO2 [mol·s-1] or [mol·s-1·x-1] | Respiratory oxygen flow is the oxygen consumption per total system, which is an extensive quantity. Flow is advancement of a transformation in a system per time [mol·s-1], when 'system' is defined as the experimental system (e.g. an open or closed chamber). Flow is distinguished from the size-specific quantity flux obtained by normalization of flow per volume of the experimental system [mol·s-1·m-3]. An experimental object, e.g. a living cell, may be considered as the 'experimental system'. Then oxygen flow per cell has the unit [mol·s-1·x-1], where [x] is the elementary unit for a count. Oxygen flow or respiration per cell [amol·s-1·x-1] = [pmol·s-1·Mx-1] is normalized for the cell count, distinguished from oxygen flux (e.g. per mg protein or wet mass). These are different forms of normalization of rate. |
| Oxygen flux - instrumental background | J°O2 | Instrumental background oxygen flux, J°O2, in a respirometer is due to oxygen consumption by the POS, and oxygen diffusion into or out of the aqueous medium in the O2k-chamber. It is a property of the instrumental system, measured in the range of experimental oxygen levels by a standardized instrumental O2 background test. The oxygen regime from air saturation towards zero oxygen is applied generally in experiments with isolated mitochondria, and living or permeabilized cells. To overcome oxygen diffusion limitation in permeabilized fibers and homogenates, an elevated oxygen regime is applied, requiring instrumental background test in the same range of elevated oxygen. |
| Oxygen kinetics | Oxygen kinetics describes the dependence of respiration of isolated mitochondria or cells on oxygen partial pressure. Frequently, a strictly hyperbolic kinetics is observed, with two parameters, the oxygen pressure at half-maximum flux, p50, and maximum flux, Jmax. The p50 is in the range of 0.2 to 0.8 kPa for cytochrome c oxidase, isolated mitochondria and small cells, strongly dependent on Jmax and coupling state. | |
| Oxygen pressure | pO2 [kPa] | Oxygen pressure or partial pressure of oxygen [kPa], related to oxygen concentration in solution by the oxygen solubility, SO2 [µM/kPa]. |
| Oxygen sensor test | POS test | The O2 sensor test is an important component of Oroboros Quality Management. The OroboPOS test is described in detail in MiPNet06.03 POS-calibration-SOP, is performed after switching on the Oroboros O2k, and is required as a basis of technical service of the instrument. |
| Oxygen signal | The oxygen signal of the Oroboros O2k is transmitted from the electrochemical polarographic oxygen sensor (OroboPOS) for each of the two O2k-chambers to DatLab. The primary signal is a current [µA] which is converted into a voltage [V] (raw signal), and calibrated in SI units for amount of substance concentration [µmol·L-1 or µM]. For technical reasons, the raw signal is given in [V] (DatLab 7 and previous) or [µA] (DatLab 8). The value of the raw signal is the same, independent of the displayed unit ([V] or [µA]). In the following sections, only [µA] is used for information on the raw signal, but the same values in [V] apply for the raw signal when using DL7 or previous versions. | |
| Oxygen solubility | SO2 [µM/kPa] | The oxygen solubility, SO2 [µM/kPa] = [(µmol·L-1)/kPa], expresses the oxygen concentration in solution in equilibrium with the oxygen pressure in a gas phase, as a function of temperature and composition of the solution. The inverse of oxygen solubility is related to the activity of dissolved oxygen. The oxygen solubility in solution, SO2(aq), depends on temperature and the concentrations of solutes in solution, whereas the dissolved oxygen concentration at equilibrium with air, cO2*(aq), depends on SO2(aq), barometric pressure and temperature. SO2(aq) in pure water is 10.56 µM/kPa at 37 °C and 12.56 µM/kPa at 25 °C. At standard barometric pressure (100 kPa), cO2*(aq) is 207.3 µM at 37 °C (19.6 kPa partial oxygen pressure) or 254.7 µM at 25 °C (20.3 kPa partial oxygen pressure). In MiR05 and serum, the corresponding saturation concentrations are lower due to the oxygen solubility factor: 191 and 184 µM at 37 °C or 234 and 227 µM at 25 °C. |
| Oxygen solubility factor | FM | The oxygen solubility factor of the incubation medium, FM, expresses the effect of the salt concentration on oxygen solubility relative to pure water. In mitochondrial respiration medium MiR05, MiR05-Kit and MiR06, FM is 0.92 (determined at 30 and 37 °C) and in culture media is 0.89 (at 37 °C). FM varies depending on the temperature and composition of the medium. To determine the FM based on the oxygen concentration, specific methods and equipment are needed (see references Rasmussen HN, Rasmussen UF 2003 in MiPNet06.03). For other media, FM may be estimated using Table 4 in MiPNet06.03. For this purpose KCl based media can be described as "seawater" of varying salinity. The original data on sucrose and KCl-media (Reynafarje et al 1985), however, have been critizesed as artefacts and the FM of 0.92 is suggested in the temperature range of 10 °C to 40 °C as for MiR05. |
| PC requirements | The PC requirements for controlling an O2k and data recording with DatLab are found here. | |
| POS calibration - dynamic | Calibration of the sensor response time. See also POS calibration - static. | |
| POS calibration - static | F5 | Two-point calibration of the polarographic oxygen sensor, comprising Air calibration and Zero calibration. See also POS calibration - dynamic. |
| PX calibration - DatLab | pX calibration | |
| Plot - DatLab | Ctrl+F6 | A plot in DatLab represents a specific channel in the graph. To change the Layout for DatLab graphs go to [Graph]/Select plots to open the Graph layout window. |
| Polarization voltage | U | A polarization voltage of 600 mV to 800 mV is applied between anode and cathode of the polarographic oxygen sensor, resulting in a current when oxygen is consumed. The current is converted by the electronics to a voltage (raw signal) which must not be confused with the polarization voltage. |
| Protocol editor - DatLab | ||
| Q calibration - DatLab | Q calibration | |
| Quit - DatLab | Close DatLab files and quit the program. | |
| Raw signal of the oxygen sensor | R | The raw signal of the polarographic oxygen sensor is the current Iel [µA], 1 µA = 10-6 C·s-1, (DatLab 8) or the electric potential difference (voltage) [V], 1 V = 1 J·C-1, obtained after a current-to-voltage conversion in the O2k (DatLab 7 and previous versions). |
| Recalculate slope | Select Recalculate slope (Recalc. slope) in the Mark information window to restore data points in the marked section of the active Flux / Slope plot, if Delete points or Interpolate points was used before. The entire plot is recalculated, such that other marked sections which may have been deleted are also restored. Compare Restore points. | |
| Restore points | Select Restore points in the Mark information window to restore data points in the marked section of the active signal plot, if Delete points or Interpolate points was used before. Compare Recalculate slope. | |
| Run DL-Protocol/Set O2 limit | DL-Protocols (DLP) can be selected in DatLab 7 in the pull-down menu 'Protocol': Set DL-Protocol / O2 limit. A DL-Protocol defines the sequence of Events and Marks and can be assigned to O2k-Chamber A or B, or both. Linked to DL-Protocols are templates for storing exported data in a database and for data analysis. Instrumental DL-Protocols are used for calibrations and instrumental quality control, without experimental sample in the incubation medium. DL-Protocols for substrate-uncoupler-inhibitor titration (SUIT) provide a guide through a sequence of coupling-control states and Electron-transfer-pathway states. A library of evaluated and tested standard DL-Protocols is provided by the Oroboros team. The Titration-Injection-microPump TIP2k can be programmed for automatic control of titration steps in a DL-Protocol. In DatLab 7.4, it is possible to edit a DL-Protocol and save it as a user-specific DL-Protocol (*.DLPU). For more information, see: Enable DL-Protocol editing. A Lower O2 limit [µM] can be defined for each chamber, to trigger an automatic warning when the experimental O2 concentration declines below this limit as a WARNING to remind the user that re-oxygenation of the medium may be required. | |
| SUIT: Browse DL-Protocols and templates | A comprehensive library of SUIT protocols including DatLab example traces, instructions, brief explanatory texts, links to relevant pages, representative diagrams and templates for data evaluation can be browsed from inside DatLab 7.4. Click on menu [Protocols]\SUIT: Browse DL-Protocols and templates to open a folder with all the SUIT protocols provided with the DatLab 7.4. DL-Protocols (DLP) for different sample preparations can be chosen to assess multiple sequences of respiratory coupling control and ET-pathway states. DL-Protocols posses unique D## codes and comprise a fixed sequence of events and marks which cannot be changed by the user. However, the users can edit titration volumes and concentrations in the Overview window of a DL-protocol, save the overview, and export the file as a user-specific DL-Protocol [File / Export / A or B: Export DL-Protocol User (*.DLPU)]. In DatLab 7.4, fixed sequence of events and marks can be changed (Skip/Added) in a SUIT protocol by the user. Moreover, editions of text, instructions, concentrations and titration volumes of injections in a specific DL-Protocol can be edited and saved as user-specific DL-Protocol [File]\Export\DL-Protocol User (*.DLPU). For more information, see: Enable DL-Protocol editing. | |
| SUITbrowser | Use the SUITbrowser to find the substrate-uncoupler-inhibitor-titration (SUIT) protocol most suitable for addressing your research questions.
Open the SUITbrowser: http://suitbrowser.oroboros.at/
How to find a DL-Protocol (DLP) | |
| Sample - DatLab | F3 | In the window Sample and medium, information is entered and displayed for the sample and medium. Entries can be edited any time during the experiment or during post-experiment analysis. All related results are recalculated instantaneously with the new parameters. |
| Save - DatLab | Ctrl+S | Save a DatLab file. When disconnected from the O2k, save any changes made under the identical file name overwriting the previous file. Such changes do not affect the raw data of the experiment, but relate to calibrations, experimental protocol, marks, events, and layout. |
| Save and Disconnect | Ctrl+F4 | Save and Disconnect: Stops data acquisition and disconnects from the O2k (only for DatLab 7) |
| Save as - DatLab | Save as a DatLab file. When disconnected from the O2k, save the file under a different file name, optionally in a different directory. | |
| Scaling - DatLab | F6 | Scaling a graph in DatLab provides flexibility to vary the display of the plots and create Graph layouts. It allows viewing a data plot in differently scaled graphs, zooming the signal and time scales, and scrolling along the axes of the graph provide maximum information on the current experiment. This does not influence the format of stored data. Different ranges for the axes change the appearance of data dramatically. It is highly recommended to use reference layouts. »Compare: Select plots - DatLab. |
| Scaling factor | Scaling factor determines the multiplication factor that is applied to the time derivative of the signal. | |
| Select O2k - DatLab | Select O2k - DatLab | |
| Select plots - DatLab | Ctrl+F6 | In the pull-down menue [Graph], Select plots opens the Graph layout window 'Plots'. For each graph, the plots shown with the Y1 or Y2 axis can be selected, axis labels and line styles can be defined, the unit for the calibrated signal can be changed, Flux/Slope can be chosen to be displayed as Flux per volume or as normalized specific flux/flow, the background correction can be switched on or off, and the channel can be selectively displayed as the raw signal. Graph layouts can be selected and loaded or a Graph layout may be saved. »Compare: Scaling - DatLab. |
| Sensitivity | Sensitivity refers to the response obtained for a given amount of analyte and is often denoted by two factors: the limit of detection and the limit of quantification. | |
| Serial port | Serial port describes the connection between O2k and Computer. With the USB-Cable 2.0\Type A-B connected, select Serial port in the Connection window. Depending on the O2k series, it is possible to connect with a Serial port or USB port. | |
| Set Power O2k number - DatLab | Create an identifier for your Power O2k instrument. Since it is displayed in the status panel (bottom right) and in axis labels, it should be a short code, any combination of digits and letters is allowed. | |
| Signal line | see O2k signal line | |
| Smoothing | Various methods of smoothing can be applied to improve the signal-to-noise ratio. For instance, data points recorded over time [s] or over a range of wavelengths [nm] can be smoothed by averaging n data points per interval. Then the average of the n points per smoothing interval can be taken for each successively recorded data point across the time range or range of the spectrum to give a n-point moving average smoothing. This method decreases the noise of the signal, but clearly reduces the time or wavelength resolution. More advanced methods of smoothing are applied to retain a higher time resolution or wavelength resolution. | |
| Solubility | SG | The solubility of a gas, SG, is defined as concentration divided by partial pressure, SG = cG·pG-1. |
| Start recording - DatLab | In DatLab 8, the start recording window allows to select protocols or settings before starting recording a file. | |
| Status line | see O2k status line | |
| Steady state | A system is in a steady state if the state variables of a dynamic system do not change over time due to exchange processes with the environment, which compensate for internal dissipative transformations — such as chemical reactions or diffusion — and thus prevent any changes of the system and externalize dissipative changes to the environment. The dynamic nature of the steady state differentiates it from the thermodynamic equilibrium state. {Quote} Steady states can be obtained only in open systems, in which changes by internal transformations, e.g., O2 consumption, are instantaneously compensated for by external fluxes across the system boundary, e.g., O2 supply, thus preventing a change of O2 concentration in the system (Gnaiger 1993). Mitochondrial respiratory states monitored in closed systems satisfy the criteria of pseudo-steady states for limited periods of time, when changes in the system (concentrations of O2, fuel substrates, ADP, Pi, H+) do not exert significant effects on metabolic fluxes (respiration, phosphorylation). Such pseudo-steady states require respiratory media with sufficient buffering capacity and substrates maintained at kinetically-saturating concentrations, and thus depend on the kinetics of the processes under investigation. {end of Quote: BEC 2020.1}. Whereas fluxes may change at a steady state over time, concentrations are maintained constant. The 'respiratory steady state' (Chance and Williams 1955) is characterized by constant fluxes (O2 flux, H2O2 flux) and measured variables of state (cytochrome redox states, Q redox state, NADH redox state, mitochondrial membrane potential). High-resolution respirometry allows for the measurement of several parameters (e.g. O2 flux, H2O2 flux, mitochondrial membrane potential) at pseudo-steady states, when changes of concentrations in the closed system do not exert any control on fluxes. Combination with the Titration-Injection microPump (TIP2k) allows operation with programmable titration regimes at steady-state ADP concentration (Gnaiger 2001), oxygen concentration (oxystat mode; Gnaiger et al 2000, Harrison et al 2015) or steady-state pH (pH-stat more), yielding an expanded flexibility in experimental design by combining the technical advantages of closed and open systems approaches. | |
| Stirrer A on/off | F11 | Toggles between stirrer on/off in the left O2k-chamber, returning to the pre set stirrer speed. |
| Stirrer B on/off | F12 | Toggles between stirrer on/off in the right O2k-chamber, returning to the pre set stirrer speed. |
| Stirrer power | F11, F12 | Stirrer power is switched on and off during operation of the Oroboros O2k in DatLab by pressing [F11] (left chamber) and [F12] (right chamber), respectively. This is functional only with a stirrer bar added to each O2k chamber. |
| Stirrer test | F9 | A stirrer test is performed in the Oroboros O2k for quick evaluation of the performance of the OroboPOS and for dynamic calibration. Stirring is stopped in both chambers and restarted after a selected period. The default period is 30 s, for experiments at 37 °C. At lower experimental temperature, this period should be prolonged (60 s at 25 °C). In the SOP (O2k Quality Control) for the O2 sensor test, the stirrer test is performed in the 'open' chamber in conjunction with Air calibration. In general, the stirrer test can be performed equally with an open or closed chamber. Upon automatic re-start of the stirrer (On), the increase of the oxygen signal should be rapid and monoexponential. |
| Synchronous time axes | Synchronous time axes sets, if ticked, the time axes of all graphs at an identical range and offset, which is particularly useful while panning. | |
| TIP2k - DatLab | F8 | The Titration-Injection microPump (TIP2k) provides automated injection of liquids into both O2k chambers. It is controlled via DatLab, allowing for programmable titration regimes and feedback control. |
| Temperature plot empty | Problem: Layout "01 Calibration Exp. Gr3-Temp" is selected, a third plot is displayed on the screen but it remains empty (no plot is shown). Newer versions of DatLab include pre-installed layouts which do not recognize some channel designations from older O2k series. | |
| Time resolution | Time resolution in respirometric measurements is influenced by three parameters: the response time of the POS, the data sampling interval and the number of points used for flux calculation. | |
| USB port | The USB port describes the connection between O2k and Computer. With the USB cable connected, select USB port in the Connection window. Depending on the O2k series, it is possible to connect with a USB port or Serial port. | |
| Uncoupler titrations | In uncoupler titrations various uncouplers, such as CCCP, FCCP or DNP are applied to uncouple mitochondrial electron transfer from phosphorylation (ATP synthase, ANT and phosphate carrier), particularly with the aim to measure ET capacity. ET capacity is maximum oxygen flux measured as noncoupled respiration with optimum uncoupler concentration. | |
| Upper O2 limit - DatLab | A Upper O2 limit [µM] can be defined for each O2k-chamber, to trigger an automatic warning when the experimental O2 concentration rises beyond this limit. | |
| User - DatLab | A user name is | |
| User code - DatLab | A user code or name is entered upon starting DatLab. This window pops up automatically after opening DatLab. Usernames are connected with personal graph layouts. | |
| Zero calibration | R0 | Zero calibration is, together with air calibration, one of the two steps of the POS calibration. It is performed in the closed chamber after all the oxygen has been depleted by the addition of dithionite or by respiration of imt or cells. Any incubation medium can be used for zero calibration with dithionite or sample. Unlike air calibration, it is not necessary to perform a zero calibration on each experimental day. After performing a zero calibration, it is recommended not running other experiments on the same day. Even after standard cleaning of the O2k-chambers, there might be residual amounts of reduced dithionite in the chamber, affecting the oxygen flux in subsequent experiments performed on the same day. |
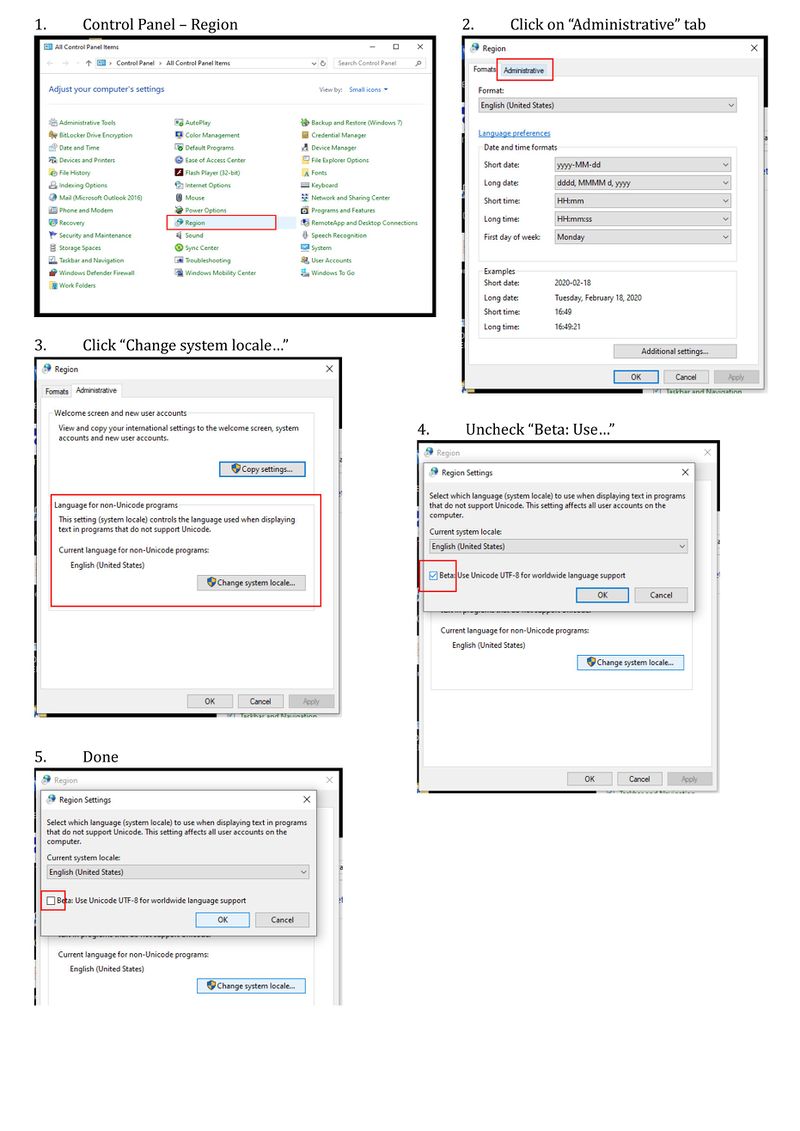
Troubleshooting
Problems with text
- e.g., J°1 mark name appears wrong or is not recognized by DatLab, or other events or marks names appear incorrectly.
- Select a language option such as English (United Kingdom) or English (United States):

Problems with text in the “Mark Statistics” window
- e.g., In the “Mark statistics” window, values for the “O2 slope background” fields do not appear or units are incorrect.
- Example:
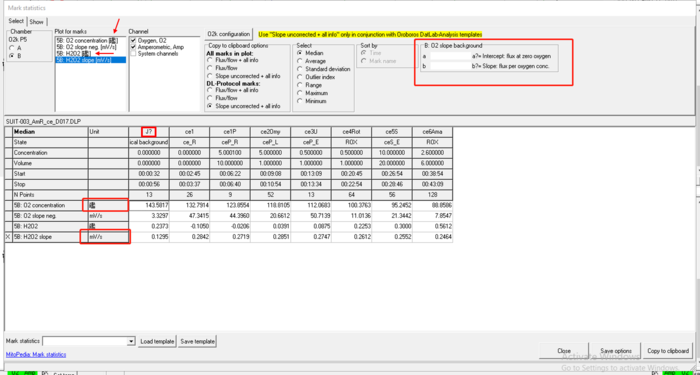
- It is possible to retrieve the values and correct units displayed in the “Mark statistics” window by updating the Windows control panel settings. Follow the steps below:


Further links
- Related topics