The MitoPedia terminology is developed continuously in the spirit of Gentle Science.
- Related topics: »Respiratory states, »Respiratory control ratios, »Fluorometry, »Spectrophotometry
| Term | Abbreviation | Description |
|---|---|---|
| 1PGM;2D;3U;4S;5Rot- | NS(PGM) | 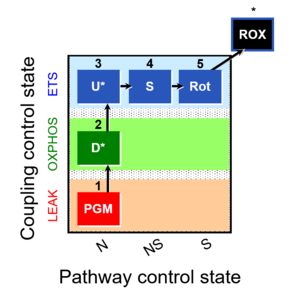 |
| Additive effect of convergent electron flow | Aα&β | Additivity Aα&β describes the principle of substrate control of mitochondrial respiration with convergent electron flow. The additive effect of convergent electron flow is a consequence of electron flow converging at the Q-junction from respiratory Complexes I and II (NS or CI&II e-input). Further additivity may be observed by convergent electron flow through glycerophosphate dehydrogenase and electron-transferring flavoprotein Complex. Convergent electron flow corresponds to the operation of the TCA cycle and mitochondrial substrate supply in vivo. Physiological substrate combinations supporting convergent NS e-input are required for reconstitution of intracellular TCA cycle function. Convergent electron flow simultaneously through Complexes I and II into the Q-junction supports higher OXPHOS capacity and ET capacity than separate electron flow through either CI or CII. The convergent NS effect may be completely or partially additive, suggesting that conventional bioenergetic protocols with mt-preparations have underestimated cellular OXPHOS-capacities, due to the gating effect through a single branch. Complete additivity is defined as the condition when the sum of separately measured respiratory capacities, N + S, is identical to the capacity measured in the state with combined substrates, NS (CI&II). This condition of complete additivity, NS=N+S, would be obtained if electron channeling through supercomplex CI, CIII and CIV does not interact with the pool of redox intermediates in the pathway from CII to CIII and CIV, and if the capacity of the phosphorylation system does not limit OXPHOS capacity (excess E-P capacity factor is zero). In most cases, however, additivity is incomplete, NS < N+S. |
| Advancement per volume | dtrY [MU∙L-1] | Advancement per volume or volume-specific advancement, dtrY, is related to advancement of a transformation, dtrY = dtrξ∙V-1 [MU∙L-1]. Compare dtrY with the amount of substance j per volume, cj (concentration), related to amount, cj = nj∙V-1 [mol∙V-1]. Advancement per volume is particularly introduced for chemical reactions, drY, and has the dimension of concentration (amount per volume [mol∙L-1]). In an open system at steady-state, however, the concentration does not change as the reaction advances. Only in closed systems and isolated systems, specific advancement equals the change in concentration divided by the stoichiometric number, drY = dcj/νj (closed system) drY = drcj/νj (general) With a focus on internal transformations (i; specifically: chemical reactions, r), dcj is replaced by the partial change of concentration, drcj (a transformation variable or process variable). drcj contributes to the total change of concentration, dcj (a system variable or variable of state). In open systems at steady-state, drcj is compensated by external processes, decj = -drcj, exerting an effect on the total concentration change of substance j, dcj = drcj + decj = 0 (steady state) dcj = drcj + decj (general) |
| Air calibration | R1 | Air calibration of an oxygen sensor (polarographic oxygen sensor) is performed routinely on any day before starting a respirometric experiment. The volume fraction of oxygen in dry air is constant. An aqueous solution in equilibrium with air has the same partial pressure as that in water vapour saturated air. The water vapour is a function of temperature only. The partial oxygen pressure in aqueous solution in equilibrium with air is, therefore, a function of total barometric pressure and temperature. Bubbling an aqueous solution with air generates deviations from barometric pressure within small gas bubbles and is, therefore, not recommended. To equilibrate an aqueous solution ata known partial pressure of oxygen [kPa], the aqueous solution is stirred rigorously in a chamber enclosing air at constant temperature. The concentration of oxygen, cO2 [µM], is obtained at any partial pressure by multiplying the partial pressure by the oxygen solubility, SO2 [µM/kPa]. SO2 is a function of temperature and composition of the salt solution, and is thus a function of the experimental medium. The solubility factor of the medium, FM, expresses the oxygen solubility relative to pure water at any experimental temperature. FM is 0.89 in serum (37 °C) and 0.92 in MiR06 or MiR05 (30 °C and 37 °C). |
| Barometric pressure | pb [Pa] | Barometric pressure, pb, is an important variable measured for calibration of oxygen sensors in solutions equilibrated with air. The atm-standard pressure (1 atm = 760 mmHg = 101.325 kPa) has been replaced by the SI standard pressure of 100 kPa. The partial pressure of oxygen, pO2, in air is a function of barometric pressure, which changes with altitude and locally with weather conditions. The partial oxygen pressure declines by 12 % to 14 % per 1,000 m up to 6,000 m altitude, and by 15 % to 17 % per 1,000 m between 6,000 and 9,000 m altitude. The O2k-Barometric Pressure Transducer is built into the Oroboros O2k as a basis for accurate air calibrations in high-resolution respirometry. For highest-level accuracy of calculation of oxygen pressure, it is recommended to compare at regular intervals the barometric pressure recording provided by the O2k with a calibrated barometric pressure recording at an identical time point and identical altitude. The concept of gas pressure or barometric pressure can be related to the generalized concept of isomorphic pressure. |
| Basal respiration | BMR | Basal respiration or basal metabolic rate (BMR) is the minimal rate of metabolism required to support basic body functions, essential for maintenance only. BMR (in humans) is measured at rest 12 to 14 hours after eating in a physically and mentally relaxed state at thermally neutral room temperature. Maintenance energy requirements include mainly the metabolic costs of protein turnover and ion homeostasis. In many aerobic organisms, and particularly well studied in mammals, BMR is fully aerobic, i.e. direct calorimetry (measurement of heat dissipation) and indirect calorimetry (measurement of oxygen consumption multiplied by the oxycaloric equivalent) agree within errors of measurement (Blaxter KL 1962. The energy metabolism of ruminants. Hutchinson, London: 332 pp [1]). In many cultured mammalian cells, aerobic glycolysis contributes to total ATP turnover (Gnaiger and Kemp 1990 [2]), and under these conditions, 'respiration' is not equivalent to 'metabolic rate'. Basal respiration in humans and skeletal muscle mitochondrial function (oxygen kinetics) are correlated (Larsen et al 2011 [3]). » MiPNet article |
| Biochemical threshold effect | Due to threshold effects, even a large defect diminishing the velocity of an individual enzyme results in only minor changes of pathway flux. | |
| Calorespirometric ratio | CR ratio [kJ/mol] | The calorimetric/respirometric or calorespirometric ratio (CR ratio) is the ratio of calorimetrically and respirometrically measured heat and oxygen flux, determinded by calorespirometry. The experimental CR ratio is compared with the theoretically derived oxycaloric equivalent, and agreement in the range of -450 to -480 kJ/mol O2 indicates a balanced aerobic energy budget (Gnaiger and Staudigl 1987). In the transition from aerobic to anaerobic metabolism, there is a limiting pO2, plim, below which CR ratios become more exothermic since anaerobic energy flux is switched on. |
| Calorespirometry | CR | Calorespirometry is the method of measuring simultaneously metabolic heat flux (calorimetry) and oxygen flux (respirometry). The calorespirometric ratio (CR ratio; heat/oxygen flux ratio) is thus experimentally determined and can be compared with the theoretical oxycaloric equivalent, as a test of the aerobic energy balance. |
| Cell count and normalization in HRR | Nce | The cell count Nce is the number of cells, expressed in the abstract unit [x] (1 Mx = 106 x). The elementary entity cell Uce [x] is the real unit, the 'single individual cell'. A cell count is the multitude or number N of cells, Nce = N·Uce (Gnaiger MitoFit Preprints 2020.4). Normalization of respiratory rate by cell count yields oxygen flow IO2 expressed in units [amol·s-1·x-1] (=10-18 mol·s-1·x-1). |
| Cell ergometry | ||
| Cell respiration | Cell respiration channels metabolic fuels into the chemiosmotic coupling (bioenergetic) machinery of oxidative phosphorylation, being regulated by and regulating oxygen consumption (or consumption of an alternative final electron acceptor) and molecular redox states, ion gradients, mitochondrial (or microbial) membrane potential, the phosphorylation state of the ATP system, and heat dissipation in response to intrinsic and extrinsic energy demands. See also respirometry. In internal or cell respiration in contrast to fermentation, redox balance is maintained by external electron acceptors, transported into the cell from the environment. The chemical potential between electron donors and electron acceptors drives the electron transfer pathway, generating a chemiosmotic potential that in turn drives ATP synthesis. | |
| Closed system | A closed system is a system with boundaries that allow external exchange of energy (heat and work), but do not allow exchange of matter. A limiting case is light and electrons which cross the system boundary when work is exchanged in the form of light or electric energy. If the surroundings are maintained at constant temperature, and heat exchange is rapid to prevent the generation of thermal gradients, then the closed system is isothermal. A frequently considered case are closed isothermal systems at constant pressure (and constant volume with aqueous solutions). Changes of closed systems can be partitioned according to internal and external sources. Closed systems may be homogenous (well mixed and isothermal), continuous with gradients, or discontinuous with compartments (heterogenous). | |
| Comparison of respirometric methods | The comparison of respirometric methods provides the basis to evaluate different instrumental platforms and different mitochondrial preparations, as a guide to select the best approach and to critically evaluate published results. | |
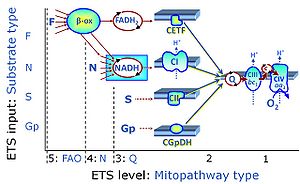
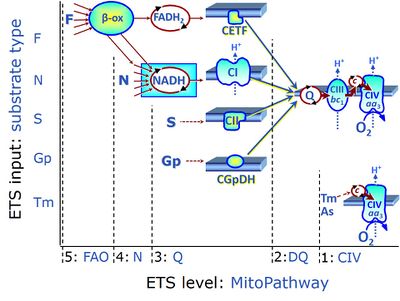
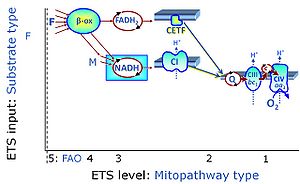
| Convergent electron flow | n.a. | Convergent electron flow is built into the metabolic design of the Electron transfer pathway. The glycolytic pathways are characterized by important divergent branchpoints: phosphoenolpyruvate (PEPCK) branchpoint to pyruvate or oxaloactetate; pyruvate branchpoint to (aerobic) acetyl-CoA or (anaerobic) lactate or alanine. The mitochondrial Electron transfer pathway, in contrast, is characterized by convergent junctions: (1) the N-junction and F-junction in the mitochondrial matrix at ET-pathway level 4, with dehydrogenases (including the TCA cycle) and ß-oxidation generating NADH and FADH2 as substrates for Complex I and electron-transferring flavoprotein complex, respectively, and (2) the Q-junction with inner mt-membrane respiratory complexes at ET-pathway level 3, reducing the oxidized ubiquinone and partially reduced semiquinone to the fully reduced ubiquinol, feeding electrons into Complex III. |
| Coupled respiration | Coupled respiration drives oxidative phosphorylation of the diphosphate ADP to the triphosphate ATP, mediated by proton pumps across the inner mitochondrial membrane. Intrinsically uncoupled respiration, in contrast, does not lead to phosphorylation of ADP, despite of protons being pumped across the inner mt-membrane. Coupled respiration, therefore, is the coupled part of respiratory oxygen flux that pumps the fraction of protons across the inner mt-membrane which is utilized by the phosphorylation system to produce ATP from ADP and Pi. In the OXPHOS state, mitochondria are in a partially coupled state, and the corresponding coupled respiration is the free OXPHOS capacity. In the state of ROUTINE respiration, coupled respiration is the free ROUTINE activity. | |
| Coupling-control efficiency | Coupling-control efficiencies are flux control efficiencies jZ-Y at a constant ET-pathway competent state. | |
| Coupling-control protocol | CCP | A coupling-control protocol CCP induces different coupling control states at a constant electron-transfer-pathway state. Residual oxygen consumption (Rox) is finally evaluated for Rox correction of flux. The CCP may be extended, when further respiratory states (e.g. cell viability test; CIV assay) are added to the coupling control module consisting of three coupling control states. The term phosphorylation control protocol, PCP, has been introduced synonymous for CCP. » MiPNet article |
| Coupling-control ratio | CCR | Coupling-control ratios CCR are flux control ratios FCR at a constant mitochondrial pathway-control state. In mitochondrial preparations, there are three well-defined coupling states of respiration: LEAK respiration, OXPHOS, and Electron-transfer-pathway state (ET state). In these states, the corresponding respirtory rates are symbolized as L, P, and E. In living cells, the OXPHOS state cannot be induced, but in the ROUTINE state the respiration rate is R. A reference rate Z is defined by taking Z as the maximum flux, i.e. flux E in the ET-state, such that the lower and upper limits of the CCR are defined as 0.0 and 1.0. Then there are two mitochondrial CCR, L/E and P/E, and two CCR for living cells, L/E and R/E. |
| Coupling-control state | CCS | Coupling-control states are defined in mitochondrial preparations (isolated mitochondria, permeabilized cells, permeabilized tissues, homogenates) as LEAK respiration, OXPHOS, and ET states, with corresponding respiration rates (L, P, E) in any electron-transfer-pathway state which is competent for electron transfer. These coupling states are induced by titration of ADP and uncouplers, and application of specific inhibitors of the phosphorylation pathway. In living cells, the coupling-control states are LEAK respiration, ROUTINE, and ET states of respiration with corresponding rates L, R, E, using membrane-permeable inhibitors of the phosphorylation system (e.g. oligomycin) and uncouplers (e.g. CCCP). Coupling-control protocols induce these coupling-control states sequentially at a constant electron-transfer-pathway state. |
| Crabtree effect | The Crabtree effect describes the observation that respiration is frequently inhibited when high concentrations of glucose or fructose are added to the culture medium - a phenomenon observed in numerous cell types, particularly in proliferating cells, not only tumor cells but also bacteria and yeast. The Pasteur effect (suppression of glycolysis by oxygen) is the converse of the Crabtree effect (suppression of respiration by high concentration of glucose or fructose). | |
| Cyclic voltammetry - DatLab | Cyclic voltammetry | |
| Cytochrome c control efficiency | jcyt c | The cytochrome c control efficiency expresses the control of respiration by externally added cytochrome c, c, as a fractional change of flux from substrate state CHNO to CHNOc. These fluxes are corrected for Rox and may be measured in the OXPHOS state or ET state, but not in the LEAK state. In this flux control efficiency, CHNOc is the reference state with stimulated flux; CHNO is the background state with CHNO substrates, upon which c is added: jcyt c = (JCHNOc-JCHNO)/JCHNOc. |
| Dilution effect | Dilution of the concentration of a compound or sample in the experimental chamber by a titration of another solution into the chamber. | |
| Dithionite | Dit Dit - (The abbreviation 'Dith' has been used previously and is stepwise replaced by Dit.) | The sodium salt of Dithionite Na2S2O4 (Dit) is the 'zero oxygen solution powder' used for calibration of oxygen sensors at zero oxygen concentration, or for stepwise reduction of oxygen concentrations in instrumental O2 background tests. It is not recommended to use dithionite in experiments with biological samples or several multisensor approaches, for these see Setting the oxygen concentration. |
| Dyscoupled respiration | Dyscoupled respiration is LEAK respiration distinguished from intrinsically (physiologically) uncoupled and from extrinsic experimentally uncoupled respiration as an indication of extrinsic uncoupling (pathological, toxicological, pharmacological by agents that are not specifically applied to induce uncoupling, but are tested for their potential dyscoupling effect). Dyscoupling indicates a mitochondrial dysfunction. In addition to intrinsic uncoupling, dyscoupling occurs under pathological and toxicological conditions. Thus a distinction is made between physiological uncoupling and pathologically defective dyscoupling in mitochondrial respiration. | |
| E-L coupling efficiency | jE-L | |
| ET capacity | E | |
| Electron flow | Ie | Electron flow through the mitochondrial Electron transfer pathway (ET-pahway) is the scalar component of chemical reactions in oxidative phosphorylation (OXPHOS). Electron flow is most conveniently measured as oxygen consumption (oxygraphic measurement of oxygen flow), with four electrons being taken up when oxygen (O2) is reduced to water. |
| Electron leak | Electrons that escape the electron transfer pathway without completing the reduction of oxygen to water at cytochrome c oxidase, causing the production of ROS. The rate of electron leak depends on the topology of the complex, the redox state of the moiety responsible of electron leakiness and usually on the protonmotive force (Δp). In some cases, the Δp dependance relies more on the ∆pH component than in the ∆Ψ. | |
| Electron transfer pathway | ET pathway | In the mitochondrial electron transfer pathway (ET pathway) electrons are transferred from externally supplied reduced fuel substrates to oxygen. Based on this experimentally oriented definition (see ET capacity), the ET pathway consists of (1) the membrane-bound ET pathway with respiratory complexes located in the inner mt-membrane, (2) TCA cycle and other mt-matrix dehydrogenases generating NADH and succinate, and (3) the carriers involved in metabolite transport across the mt-membranes. » MiPNet article |
| Electron-transfer-pathway state | ET-pathway state |
Electron-transfer-pathway states are obtained in mitochondrial preparations (isolated mitochondria, permeabilized cells, permeabilized tissues, tissue homogenate) by depletion of endogenous substrates and addition to the mitochondrial respiration medium of fuel substrates (CHNO) activating specific mitochondrial pathways, and possibly inhibitors of specific pathways. Mitochondrial electron-transfer-pathway states have to be defined complementary to mitochondrial coupling-control states. Coupling-control states require ET-pathway competent states, including oxygen supply. Categories of SUIT protocols are defined according to mitochondrial ET-pathway states. » MiPNet article |
| Enable DL-Protocol editing | Enable DL-Protocol editing is a novel function of DatLab 7.4 offering a new feature in DL-Protocols: flexibility. Fixed sequences of events and marks can be changed (Skip/Added) in a SUIT protocol by the user. Moreover, the text, instructions, concentrations and titration volumes of injections in a specific DL-Protocol can be edited and saved as user-specific DL-Protocol [File]\Export\DL-Protocol User (*.DLPU). To enable it, under the 'Protocols' tab in the menu, select the option 'Enable DL-Protocol editing', and then select the plot in which the marks will be set (e.g., O2 flux per V). Select the 'Overview' window, where you will be able to edit events and marks names, definition/state, final concentration and titration volumes, as well as select a mark as 'multi' for multiple titration steps, skip a mark, or add a new event or mark. After saving, export a DL-Protocol User (DLPU) and load it before running the next experiments. If users of DatLab versions older than DatLab 7.4 wish to alter the nature of the chemicals used or the sequence of injections, we ask them to contact the O2k-Technical Support.
For more information:  Export DL-Protocol User (*.DLPU) Export DL-Protocol User (*.DLPU) | |
| Ergodynamic efficiency | ε | The ergodynamic efficiency, ε (compare thermodynamic efficiency), is a power ratio between the output power and the (negative) input power of an energetically coupled process. Since power [W] is the product of a flow and the conjugated thermodynamic force, the ergodynamic efficiency is the product of an output/input flow ratio and the corresponding force ratio. The efficiency is 0.0 in a fully uncoupled system (zero output flow) or at level flow (zero output force). The maximum efficiency of 1.0 can be reached only in a fully (mechanistically) coupled system at the limit of zero flow at ergodynamic equilibrium. The ergodynamic efficiency of coupling between ATP production (DT phosphorylation) and oxygen consumption is the flux ratio of DT phosphorylation flux and oxygen flux (P»/O2 ratio) multiplied by the corresponding force ratio. Compare with the OXPHOS-coupling efficiency. |
| External flow | Ie [MU·s-1] | External flows across the system boundaries are formally reversible. Their irreversible facet is accounted for internally as transformations in a heterogenous system (internal flows, Ii). |
| F-junction | The F-junction is a junction for convergent electron flow in the electron transfer pathway (ET-pathway) from fatty acids through fatty acyl CoA dehydrogenase (reduced form FADH2) to electron transferring flavoprotein (CETF), and further transfer through the Q-junction to Complex III (CIII). The concept of the F-junction and N-junction provides a basis for defining categories of SUIT protocols. Fatty acid oxidation, in the F-pathway control state, not only depends on electron transfer through the F-junction (which is typically rate-limiting) but simultaneously generates NADH and thus depends on N-junction throughput. Hence FAO can be inhibited completely by inhibition of Complex I (CI). In addition and independent of this source of NADH, the N-junction substrate malate is required as a co-substrate for FAO in mt-preparations, since accumulation of AcetylCoA inhibits FAO in the absence of malate. Malate is oxidized in a reaction catalyzed by malate dehydrogenase to oxaloacetate (yielding NADH), which then stimulates the entry of AcetylCoA into the TCA cycle catalyzed by citrate synthase. | |
| Fatty acid oxidation | FAO | Fatty acid oxidation is a multi-step process by which fatty acids are broken down in β-oxidation to generate acetyl-CoA, NADH and FADH2 for further electron transfer to CoQ. Whereas NADH is the substrate of CI, FADH2 is the substrate of electron-transferring flavoprotein complex (CETF) which is localized on the matrix face of the mtIM, and supplies electrons from FADH2 to CoQ. Before the ß-oxidation in the mitochondrial matrix, fatty acids (short-chain with 1-6, medium-chain with 7–12, long-chain with >12 carbon atoms) are activated by fatty acyl-CoA synthases (thiokinases) in the cytosol. For the mitochondrial transport of long-chain fatty acids the mtOM-enzyme carnitine palmitoyltransferase I (CPT-1; considered as a rate-limiting step in FAO) is required which generates an acyl-carnitine intermediate from acyl-CoA and carnitine. In the next step, an integral mtIM protein carnitine-acylcarnitine translocase (CACT) catalyzes the entrance of acyl-carnitines into the mitochondrial matrix in exchange for free carnitines. In the inner side of the mtIM, another enzyme carnitine palmitoyltransferase 2 (CPT-2) converts the acyl-carnitines to carnitine and acyl-CoAs, which undergo ß-oxidation in the mitochondrial matrix. Short- and medium-chain fatty acids do not require the carnitine shuttle for mitochondrial transport. Octanoate, but not palmitate, (eight- and 16-carbon saturated fatty acids) may pass the mt-membranes, but both are frequently supplied to mt-preparations in the activated form of octanoylcarnitine or palmitoylcarnitine. |
| Flux | J | Flux, J, is a specific quantity. Flux is flow, I [MU·s-1 per system] (an extensive quantity), divided by system size. Flux (e.g., oxygen flux) may be volume-specific (flow per volume [MU·s-1·L-1]), mass-specific (flow per mass [MU·s-1·kg-1]), or marker-specific (e.g. flow per mtEU). The motive unit [MU] of chemical flow or flux is the advancement of reaction [mol] in the chemical format. |
| Flux / Slope | J | Flux / Slope is the time derivative of the signal. In DatLab, Flux / Slope is the name of the pull-down menu for (1) normalization of flux (chamber volume-specific flux, sample-specific flux or flow, or flux control ratios), (2) flux baseline correction, (3) Instrumental background oxygen flux, and (4) flux smoothing, selection of the scaling factor, and stoichiometric normalization using a stoichiometric coefficient. Before changing the normalization of flux from volume-specific flux to sample-specific flux or flow, or flux control ratios, please be sure to use the standard Layout 04a (Flux per volume) or 04b (Flux per volume overlay). When starting with the instrumental standard Layouts 1-3, which display the O2 slope negative, the sample-specific flux or flow, or flux control ratios will not be automatically background corrected. To obtain the background corrected specific flux or flux control ratios, it is needed to tick the background correction in the lower part of the slope configuration window. Background correction is especially critical when performing measurements in a high oxygen regime or using samples with a low respiratory flux or flow. |
| Flux baseline correction | bc | Flux baseline correction provides the option to display the plot and all values of the flux (or flow, or flux control ratio) as the total flux, J, minus a baseline flux, J0.
JV(bc) = JV - JV0
JV = (dc/dt) · ν-1 · SF - J°V
For the oxygen channel, JV is O2 flux per volume [pmol/(s·ml)] (or volume-specific O2 flux), c is the oxygen concentration [nmol/ml = µmol/l = µM], dc/dt is the (positive) slope of oxygen concentration over time [nmol/(s · ml)], ν-1 = -1 is the stoichiometric coefficient for the reaction of oxygen consumption (oxygen is removed in the chemical reaction, thus the stoichiometric coefficient is negative, expressing oxygen flux as the negative slope), SF=1,000 is the scaling factor (converting units for the amount of oxygen from nmol to pmol), and J°V is the volume-specific background oxygen flux (Instrumental background oxygen flux). Further details: Flux / Slope. |
| Flux control efficiency | jZ-Y | Flux control efficiencies express the control of respiration by a metabolic control variable, X, as a fractional change of flux from YX to ZX, normalized for ZX. ZX is the reference state with high (stimulated or un-inhibited) flux; YX is the background state at low flux, upon which X acts.
Complementary to the concept of flux control ratios and analogous to elasticities of metabolic control analysis, the flux control efficiency of X upon background YX is expressed as the change of flux from YX to ZX normalized for the reference state ZX. » MiPNet article |
| Flux control ratio | FCR | Flux control ratios FCRs are ratios of oxygen flux in different respiratory control states, normalized for maximum flux in a common reference state, to obtain theoretical lower and upper limits of 0.0 and 1.0 (0 % and 100 %). For a given protocol or set of respiratory protocols, flux control ratios provide a fingerprint of coupling and substrate control independent of (1) mt-content in cells or tissues, (2) purification in preparations of isolated mitochondria, and (3) assay conditions for determination of tissue mass or mt-markers external to a respiratory protocol (CS, protein, stereology, etc.). FCR obtained from a single respirometric incubation with sequential titrations (sequential protocol; SUIT protocol) provide an internal normalization, expressing respiratory control independent of mitochondrial content and thus independent of a marker for mitochondrial amount. FCR obtained from separate (parallel) protocols depend on equal distribution of subsamples obtained from a homogenous mt-preparation or determination of a common mitochondrial marker. |
| High-resolution respirometry | HRR | High-resolution respirometry, HRR, is the state-of-the-art approach in mitochondria and cell research to measure respiration in various types of mitochondrial preparations and living cells combined with MultiSensor modules.
Mitochondrial function and dysfunction have gained increasing interest, reflecting growing awareness of the fact that mitochondria play a pivotal role in human health and disease. HRR combines instrumental accuracy and reliability with the versatility of applicable protocols, allowing practically unlimited addition and combination of substrates, inhibitors, and uncouplers using the Oroboros O2k-technology. Substrate-uncoupler-inhibitor titration (SUIT) protocols allow the interrogation of numerous mitochondrial pathway and coupling states in a single respirometric assay. Mitochondrial respiratory pathways may be analyzed in detail to evaluate even minor alterations in respiratory coupling and pathway control patterns. The O2k-technology provides sole source instruments, with no other available instrument meeting its specifications for high-resolution respirometry. Technologically, HRR is based on the Oroboros O2k-technology, combining optimized chamber design, application of oxygen-tight materials, electrochemical sensors, Peltier-temperature control, and specially developed software features (DatLab) to obtain the unique sensitive and quantitative resolution of oxygen concentration and oxygen flux, with both, a closed-chamber or open-chamber mode of operation (TIP2k). Standardized calibration of the polarographic oxygen sensor (static sensor calibration), calibration of the sensor response time (dynamic sensor calibration), and evaluation of instrumental background oxygen flux (systemic flux compensation) provide the experimental basis for high accuracy of quantitative results and quality control in HRR. HRR can be extended for MultiSensor analysis by using the O2k-Fluo Smart-Module. Smart Fluo-Sensors are integrated into the O2k to measure simultaneously fluorometric signals using specific fluorophores. Potentiometric modules are available with ion-selective electrodes (pH, TPP+). The PB-Module extends HRR to PhotoBiology with accurate control of the light intensity and measurement of photosynthesis. The O2k and the NextGen-O2k support all these O2k-Modules. The NextGen-O2k all-in-one, however, is unique in supporting Q-Redox and NADH-Redox Modules. |
| Hydrogen ion pump | Mitochondrial hydrogen ion pumps — frequently referred to as "proton pumps" — are large enzyme complexes (CI, CIII, CIV, ATP synthase) spanning the mt-inner membrane mtIM, partially encoded by mtDNA. CI, CIII and CIV are H+ pumps that drive hydrogen ions against the electrochemical protonmotive force pmF and thus generating the pmF, driven by electron transfer from reduced substrates to oxygen. In contrast, ATP synthase (also known as CV) is a H+ pump that utilizes the exergy of proton flow along the protonmotive force to drive phosphorylation of ADP to ATP. | |
| Hydrogenion flux | JH+ | Volume-specific hydrogenion flux or H+ flux is measured in a closed system as the time derivative of H+ concentration, expressed in units [pmol·s-1·mL-1]. H+ flux can be measured in an open system at steady state, when any acidification of the medium is compensated by external supply of an equivalent amount of base. The extracellular acidification rate (ECAR) is the change of pH in the incubation medium over time, which is zero at steady state. Volume-specific H+ flux is comparable to volume-specific oxygen flux [pmol·s-1·mL-1], which is the (negative) time derivative of oxygen concentration measured in a closed system, corrected for instrumental and chemical background. pH is the negative logarithm of hydrogen ion activity. Therefore, ECAR is of interest in relation to acidification issues in the incubation buffer or culture medium. The physiologically relevant metabolic H+ flux, however, must not be confused with ECAR. |
| International oxygraph course | IOC | International Oxygraph Course (IOC), see O2k-Workshops. |
| Intracellular oxygen | pO2,i | Physiological, intracellular oxygen pressure is significantly lower than air saturation under normoxia, hence respiratory measurements carried out at air saturation are effectively hyperoxic for cultured cells and isolated mitochondria. |
| L/E coupling-control ratio | L/E | |
| L/P coupling-control ratio | L/P | |
| LEAK respiration | L | |
| Light-enhanced dark respiration | LEDR | Light-enhanced dark respiration LEDR is a sharp (negative) maximum of dark respiration in plants in response to illumination, measured immediately after switching off the light. LEDR is supported by respiratory substrates produced during photosynthesis and closely reflects light-enhanced photorespiration (Xue et al 1996). Based on this assumption, the total photosynthetic oxygen flux TP is calculated as the sum of the measured net photosynthetic oxygen flux NP plus the absolute value of LEDR. |
| Limiting pO2 | plim | In the transition from aerobic to anaerobic metabolism, there is a limiting pO2, plim, below which anaerobic energy flux is switched on and CR ratios become more exothermic than the oxycaloric equivalent. plim may be significanlty below the critical pO2. |
| Linearity | Linearity is the ability of the method to produce test results that are proportional, either directly or by a well-defined mathematical transformation, to the concentration of the analyte in samples within a given range. This property is inherent in the Beer-Lambert law for absorbance alone, but deviations occur in scattering media. It is also a property of fluorescence, but a fluorophore may not exhibit linearity, particularly over a large range of concentrations. | |
| Living cells | ce | Cell viability in living cells should be >95 % for various experimental investigations, including cell respirometry. Viable cells (vce) are characterized by an intact plasma membrane barrier function. The total cell count (Nce) is the sum of viable cells (Nvce) and dead cells (Ndce). In contrast, the plasma membrane can be permeabilized selectively by mild detergents (digitonin), to obtain the mt-preparation of permeabilized cells used for cell ergometry. Living cells are frequently labelled as intact cells in the sense of the total cell count, but intact may suggest dual meanings of viable or unaffected by a disease or mitochondrial injury. |
| Malate-aspartate shuttle | The malate-aspartate shuttle involves the glutamate-aspartate carrier and the 2-oxoglutarate carrier exchanging malate2- for 2-oxoglutarate2-. Cytosolic and mitochondrial malate dehydrogenase and transaminase complete the shuttle for the transport of cytosolic NADH into the mitochondrial matrix. It is most important in heart, liver and kidney. | |
| Microplates | Microplate readers allow large numbers of sample reactions to be assayed in well format microtitre plates. The most common microplate format used in academic research laboratories or clinical diagnostic laboratories is 96-well (8 by 12 matrix) with a typical reaction volume between 100 and 200 µL per well. a wide range of applications involve the use of fluorescence measurements , although they can also be used in conjunction with absorbance measurements. | |
| Mitochondrial marker | mt-marker | Mitochondrial markers are structural or functional properties that are specific for mitochondria. A structural mt-marker is the area of the inner mt-membrane or mt-volume determined stereologically, which has its limitations due to different states of swelling. If mt-area is determined by electron microscopy, the statistical challenge has to be met to convert area into a volume. When fluorescent dyes are used as mt-marker, distinction is necessary between mt-membrane potential dependent and independent dyes. mtDNA or cardiolipin content may be considered as a mt-marker. Mitochondrial marker enzymes may be determined as molecular (amount of protein) or functional properties (enzyme activities). Respiratory capacity in a defined respiratory state of a mt-preparation can be considered as a functional mt-marker, in which case respiration in other respiratory states is expressed as flux control ratios. » MiPNet article |
| Mitochondrial membrane potential | mtMP, ΔΨp+, ΔelFep+ [V] | The mitochondrial membrane potential difference, mtMP or ΔΨp+ = ΔelFep+, is the electric part of the protonmotive force, Δp = ΔmFeH+.
|
| Mitochondrial respiration | Integrative measure of the dynamics of complex coupled metabolic pathways, including metabolite transport across the mt-membranes, TCA cycle function with electron transfer through dehydrogenases in the mt-matrix, membrane-bound electron transfer mET-pathway, the transmembrane proton circuit, and the phosphorylation system. | |
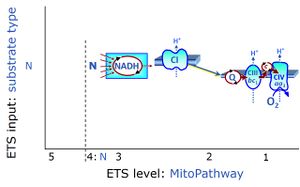
| N-junction | The N-junction is a junction for convergent electron flow in the electron transfer pathway (ET-pathway) from type N substrates (further details »N-pathway control state) through the mt-NADH pool to Complex I (CI), and further transfer through the Q-junction to Complex III (CIII). Representative type N substrates are pyruvate (P), glutamate (G) and malate (M). The corresponding dehydrogenases (PDH, GDH, MDH) and some additional TCA cycle dehydrogenases (isocitrate dehydrogenase, oxoglutarate dehydrogenase generate NADH, the substrate of Complex I (CI). The concept of the N-junction and F-junction provides a basis for defining categories of SUIT protocols based on Electron-transfer-pathway states. | |
| NADH calibration - DatLab | NADH calibration | |
| NADH electron transfer-pathway state | N | The NADH electron transfer-pathway state (N) is obtained by addition of NADH-linked substrates (CI-linked), feeding electrons into the N-junction catalyzed by various mt-dehydrogenases. N-supported flux is induced in mt-preparations by the addition of NADH-generating substrate combinations of pyruvate (P), glutamate (G), malate (M), oxaloacetate (Oa), oxoglutarate (Og), citrate, hydroxybutyrate. These N-junction substrates are (indirectly) linked to Complex I by the corresponding dehydrogenase-catalyzed reactions reducing NAD+ to NADH+H+ + H+. The most commonly applied N-junction substrate combinations are: PM, GM, PGM. The malate-anaplerotic pathway control state (M alone) is a special case related to malic enzyme (mtME). The glutamate-anaplerotic pathway control state (G alone) supports respiration through glutamate dehydrogenase (mtGDH). Oxidation of tetrahydrofolate is a NAD(P)H linked pathway with formation of formate. In mt-preparations, succinate dehydrogenase (SDH; CII) is largely substrate-limited in N-linked respiration, due to metabolite depletion into the incubation medium. The residual involvement of S-linked respiration in the N-pathway control state can be further suppressed by the CII-inhibitor malonic acid). In the N-pathway control state ET pathway level 4 is active. |
| NS-S pathway control efficiency | jNS-S | The NS-S pathway control efficiency expresses the relative stimulation of succinate supported respiration (S) by NADH-linked substrates (N), with the S-pathway control state as the background state and the NS-pathway control state as the reference state. In typical SUIT protocols with type N and S substrates, flux in the NS-pathway control state NS is inhibited by rotenone to measure flux in the S-pathway control state, S(Rot) or S. Then the NS-S pathway control efficiency in the ET-coupling state is
j(NS-S)E = (NSE-SE)/NSEThe NS-S pathway control efficiency expresses the fractional change of flux in a defined coupling-control state when inhibition by rotenone is removed from flux under S-pathway control in the presence of a type N substrate combination. Experimentally rotenone Rot is added to the NS-state. The reversed protocol, adding N-substrates to a S-pathway control background does not provide a valid estimation of S-respiration with succinate in the absence of Rot, since oxaloacetate accumulates as a potent inhibitor of succinate dehydrogenase CII. |
| Nigericin | Nigericin is a H+/K+ antiporter, which allows the electroneutral transport of these two ions in opposite directions across the mitochondrial inner membrane following the K+ concentration gradient. In the presence of K+, nigericin decreases pH in the mitchondrial matrix, thus, almost fully collapses the transmembrane ΔpH, which leads to the compensatory increase of the electric mt-membrane potential. Therefore, it is ideal to use to dissect the two components of the protonmotive force, ΔpH and mt-membrane potential. It is recommended to use the lowest possible concentration of nigericin, which creates a maximal mitochondrial hyperpolarization. In the study of Komlodi 2018 J Bioenerg Biomembr, 20 nM was applied on brain mitochondria isolated from guinea-pigs using 5 mM succinate in the LEAK state which caused maximum hyperpolarisation, but did not fully dissipate the transmembrane ΔpH. Other groups (Selivanov et al 2008; Lambert et al 2004), however, used 100 nM nigericin, which in their hands fully collapsed transmembrane ΔpH using succinate as a respiratory substrate on isolated rat brain and skeletal muscle in the LEAK state. | |
| Noise | In fluorometry and spectrophotometry, noise can be attributed to the statistical nature of the photon emission from a light source and the inherent noise in the instrument’s electronics. The former causes problems in measurements involving samples of analytes with a low extinction coefficient and present only in low concentrations. The latter becomes problematic with high absorbance samples where the light intensity emerging from the sample is very small. | |
| Noncoupled respiration | E | Noncoupled respiration is maximum electron flow in an open-transmembrane proton circuit mode of operation (see ET capacity). » MiPNet article |
| Normalization of rate | Normalization of rate (respiratory rate, rate of hydrogen peroxide production, growth rate) is required to report experimental data. Normalization of rates leads to a diversity of formats. Normalization is guided by physicochemical principles, methodological considerations, and conceptual strategies. The challenges of measuring respiratory rate are matched by those of normalization. Normalization of rates for: (1) the number of objects (cells, organisms); (2) the volume or mass of the experimental sample; and (3) the concentration of mitochondrial markers in the instrumental chamber are sample-specific normalizations, which are distinguished from system-specific normalization for the volume of the instrumental chamber (the measuring system). Metabolic flow, I, per countable object increases as the size of the object is increased. This confounding factor is eliminated by expressing rate as sample-mass specific or sample-volume specific flux, J. Flow is an extensive quantity, whereas flux is a specific quantity. If the aim is to find differences in mitochondrial function independent of mitochondrial density, then normalization to a mitochondrial marker is imperative. Flux control ratios and flux control efficiencies are based on internal normalization for rate in a reference state, are independent of externally measured markers and, therefore, are statistically robust. | |
| Nuclear respiratory factor 1 | NRF-1 | Nuclear respiratory factor 1 is a transcription factor downstream of PGC-1alpha involved in coordinated expression of nDNA and mtDNA. |
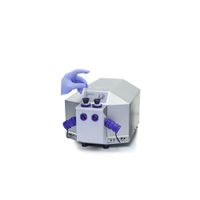
| O2k | O2k | O2k - Oroboros O2k: the modular system for high-resolution respirometry. |
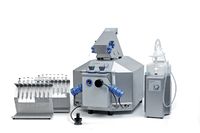
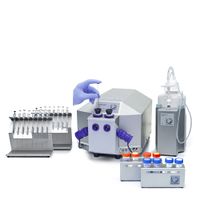
| O2k-FluoRespirometer | The Oroboros O2k-FluoRespirometer - the experimental system complete for high-resolution respirometry (HRR), including fluorometry, the TIP2k and the O2k-sV-Module allowing simultaneous monitoring of oxygen consumption together with either ROS production (AmR), mt-membrane potential (TMRM, Safranin and Rhodamine 123), Ca2+ (CaG) or ATP production (MgG). The O2k-FluoRespirometer supports all add-on O2k-Modules: O2k-TPP+ ISE-Module, O2k-pH ISE-Module, O2k-NO Amp-Module, enabling measurement of mt-membrane potential with ion sensitive electrodes (ISE for TPP+ or TPMP+) or pH. | |
| O2k-sV-Module | O2k-sV-Module | The O2k-sV-Module is the O2k small-volume module, comprised of two Duran® glass chambers of 12 mm inner diameter specifically developed to perform high-resolution respirometry with reduced amounts of biological sample, and all the components necessary for a smaller operation volume V of 0.5 mL. The current DatLab version is included in the delivery of this revolutionary module. |
| OXPHOS capacity | P | |
| Octanoate | Oca | Octanoate (octanoic acid). C8H16O2 Common name: Caprylic acid. |
| Open system | An open system is a system with boundaries that allow external exchange of energy and matter; the surroundings are merely considered as a source or sink for quantities transferred across the system boundaries (external flows, Iext). | |
| Oroboros Instruments Corp |
| |
| Oxidative phosphorylation | OXPHOS | |
| Oxycaloric equivalent | DeltakHO2 | The oxycaloric equivalent is the theoretically derived enthalpy change of the oxidative catabolic reactions per amount of oxygen respired, DeltakHO2, ranging from -430 to -480 kJ/mol O2. The oxycaloric equivalent is used in indirect calorimetry to calculate the theoretically expected metabolic heat flux from the respirometrically measured metabolic oxygen flux. Calorimetric/respirometric ratios (CR ratios; heat/oxygen flux ratios) are experimentally determined by calorespirometry. A CR ratio more exothermic than the oxycaloric equivalent of -480 kJ/mol indicates the simultaneous involvement of aerobic and anaerobic mechanisms of energy metabolism. |
| Oxygen calibration - DatLab | O2 calibration is the calibration in DatLab of the oxygen sensor. It is a prerequisite for obtaining accurate measurements of respiration. Accurate calibration of the oxygen sensor depends on (1) equilibration of the incubation medium with air oxygen partial pressure at the temperature defined by the experimenter; (2) zero oxygen calibration; (3) high stability of the POS signal tested for sufficiently long periods of time; (4) linearity of signal output with oxygen pressure in the range between oxygen saturation and zero oxygen pressure; and (5) accurate oxygen solubility for aqueous solutions for the conversion of partial oxygen pressure into oxygen concentration. The standard oxygen calibration procedure is described below for high-resolution respirometry with the calibration routine using instrumental calibration DL-Protocols in DatLab. | |
| Oxygen flow | IO2 [mol·s-1] or [mol·s-1·x-1] | Respiratory oxygen flow is the oxygen consumption per total system, which is an extensive quantity. Flow is advancement of a transformation in a system per time [mol·s-1], when 'system' is defined as the experimental system (e.g. an open or closed chamber). Flow is distinguished from the size-specific quantity flux obtained by normalization of flow per volume of the experimental system [mol·s-1·m-3]. An experimental object, e.g. a living cell, may be considered as the 'experimental system'. Then oxygen flow per cell has the unit [mol·s-1·x-1], where [x] is the elementary unit for a count. Oxygen flow or respiration per cell [amol·s-1·x-1] = [pmol·s-1·Mx-1] is normalized for the cell count, distinguished from oxygen flux (e.g. per mg protein or wet mass). These are different forms of normalization of rate. |
| Oxygen flux | JO2 | Oxygen flux, JO2, is a specific quantity. Oxygen flux is oxygen flow, IO2 [mol·s-1 per system] (an extensive quantity), divided by system size. Flux may be volume-specific (flow per volume [pmol·s-1·mL-1]), mass-specific (flow per mass [pmol·s-1·mg-1]), or marker-specific (flow per mtEU). Oxygen flux (e.g., per body mass, or per cell volume) is distinguished from oxygen flow (per number of objects, such as cells), IO2 [mol·s-1·x-1]. These are different forms of normalization of rate. |
| Oxygen flux - instrumental background | J°O2 | Instrumental background oxygen flux, J°O2, in a respirometer is due to oxygen consumption by the POS, and oxygen diffusion into or out of the aqueous medium in the O2k-chamber. It is a property of the instrumental system, measured in the range of experimental oxygen levels by a standardized instrumental O2 background test. The oxygen regime from air saturation towards zero oxygen is applied generally in experiments with isolated mitochondria, and living or permeabilized cells. To overcome oxygen diffusion limitation in permeabilized fibers and homogenates, an elevated oxygen regime is applied, requiring instrumental background test in the same range of elevated oxygen. |
| Oxygen kinetics | Oxygen kinetics describes the dependence of respiration of isolated mitochondria or cells on oxygen partial pressure. Frequently, a strictly hyperbolic kinetics is observed, with two parameters, the oxygen pressure at half-maximum flux, p50, and maximum flux, Jmax. The p50 is in the range of 0.2 to 0.8 kPa for cytochrome c oxidase, isolated mitochondria and small cells, strongly dependent on Jmax and coupling state. | |
| Oxygen pressure | pO2 [kPa] | Oxygen pressure or partial pressure of oxygen [kPa], related to oxygen concentration in solution by the oxygen solubility, SO2 [µM/kPa]. |
| Oxygen signal | The oxygen signal of the Oroboros O2k is transmitted from the electrochemical polarographic oxygen sensor (OroboPOS) for each of the two O2k-chambers to DatLab. The primary signal is a current [µA] which is converted into a voltage [V] (raw signal), and calibrated in SI units for amount of substance concentration [µmol·L-1 or µM]. For technical reasons, the raw signal is given in [V] (DatLab 7 and previous) or [µA] (DatLab 8). The value of the raw signal is the same, independent of the displayed unit ([V] or [µA]). In the following sections, only [µA] is used for information on the raw signal, but the same values in [V] apply for the raw signal when using DL7 or previous versions. | |
| Oxygen solubility | SO2 [µM/kPa] | The oxygen solubility, SO2 [µM/kPa] = [(µmol·L-1)/kPa], expresses the oxygen concentration in solution in equilibrium with the oxygen pressure in a gas phase, as a function of temperature and composition of the solution. The inverse of oxygen solubility is related to the activity of dissolved oxygen. The oxygen solubility in solution, SO2(aq), depends on temperature and the concentrations of solutes in solution, whereas the dissolved oxygen concentration at equilibrium with air, cO2*(aq), depends on SO2(aq), barometric pressure and temperature. SO2(aq) in pure water is 10.56 µM/kPa at 37 °C and 12.56 µM/kPa at 25 °C. At standard barometric pressure (100 kPa), cO2*(aq) is 207.3 µM at 37 °C (19.6 kPa partial oxygen pressure) or 254.7 µM at 25 °C (20.3 kPa partial oxygen pressure). In MiR05 and serum, the corresponding saturation concentrations are lower due to the oxygen solubility factor: 191 and 184 µM at 37 °C or 234 and 227 µM at 25 °C. |
| Oxygen solubility factor | FM | The oxygen solubility factor of the incubation medium, FM, expresses the effect of the salt concentration on oxygen solubility relative to pure water. In mitochondrial respiration medium MiR05, MiR05-Kit and MiR06, FM is 0.92 (determined at 30 and 37 °C) and in culture media is 0.89 (at 37 °C). FM varies depending on the temperature and composition of the medium. To determine the FM based on the oxygen concentration, specific methods and equipment are needed (see references Rasmussen HN, Rasmussen UF 2003 in MiPNet06.03). For other media, FM may be estimated using Table 4 in MiPNet06.03. For this purpose KCl based media can be described as "seawater" of varying salinity. The original data on sucrose and KCl-media (Reynafarje et al 1985), however, have been critizesed as artefacts and the FM of 0.92 is suggested in the temperature range of 10 °C to 40 °C as for MiR05. |
| P-L control efficiency | jP-L | |
| P/E control ratio | P/E | |
| P50 | p50 | p50 is the oxygen partial pressure at which (a) respiratory flux is 50% of maximum oxygen flux, Jmax, at saturating oxygen levels. The oxygen affinity is indirectly proportional to the p50. The p50 depends on metabolic state and rate. (b) p50 is the oxygen partial pressure at which oxygen binding (on myoglobin, haemoglobin) is 50%, or desaturation is 50%. |
| PB-Module | The PB-Module has been developed for conducting measurements of PhotoBiology, including photosynthesis. It consists of the PB Light Source and electronic components which are an integral part of the NextGen-O2k. Measurements are recorded and evaluated with the DatLab 8 software. | |
| PH calibration buffers | pH calibration buffers are prepared to obtain two or more defined pH values for calibration of pH electrodes and pH indicator dyes. | |
| POS calibration - dynamic | Calibration of the sensor response time. See also POS calibration - static. | |
| POS calibration - static | F5 | Two-point calibration of the polarographic oxygen sensor, comprising Air calibration and Zero calibration. See also POS calibration - dynamic. |
| Pathway control ratio | FCR | Substrate control ratios are flux control ratios FCR, at a constant mitochondrial coupling-control state. Whereas there are only three well-defined coupling-control states of mitochondrial respiration, L, P, E (LEAK respiration, OXPHOS, Electron transfer pathway), numerous Electron-transfer-pathway states are possible. Careful selection of the reference state, Jref, is required, for which some guidelines may be provided without the possibility to formulate general rules. FCR are best defined by taking Jref as the maximum flux (e.g. NSE), such that flux in various other respiratory states, Ji, is smaller or equal to Jref. However, this is not generally possible with FCR. For instance, the N/S pathway control ratio (at constant coupling-control state) may be larger or smaller than 1.0, depending on the mitochondrial source and various mitochondrial injuries. The S-pathway control state may be selected preferentially as Jref, if mitochondria with variable N-linked injuries are studied. In contrast, the reference state, Z, is strictly defined for flux control efficiency. |
| Photodecomposition | PD | Photodecomposition or photodegradation is the process of decay of organic material induced by increasing light intensity. Under aerobic conditions, the enhancement of photodecomposition by light intensity can be quantified by oxygen consumption in a controlled light regime. |
| Physiological pathway-control state | See Electron-transfer-pathway state. | |
| Polyether ether ketone | PEEK | Polyether ether ketone (PEEK) is a semicrystalline organic polymer thermoplastic, which is chemically very resistant, with excellent mechanical properties. PEEK is compatible with ultra-high vacuum applications, and its resistance against oxygen diffusion make it an ideal material for high-resolution respirometry (POS insulation; coating of stirrer bars; stoppers for closing the O2k-Chamber). |
| Polyvinylidene fluoride | PVDF | Polyvinylidene fluoride (PVDF) is a pure thermoplastic fluoropolymer, which is chemically very resistant, with excellent mechanical properties. It is used generally in applications requiring the highest purity, strength, and resistance to solvents, acids, bases and heat (Wikipedia). PVDF is resistant against oxygen diffusion which makes it an ideal material for high-resolution respirometry (coating of stirrer bars; stoppers for closing the O2k-Chamber). |
| Power O2k-FluoRespirometer | Power O2k-FluoRespirometer - optional configuration as additional system for increasing output combined with the O2k-FluoRespirometer (O2k-Series H). The Power O2k-FluoRespirometer includes the TIP2k and the O2k-sV-Module, and supports all add-on O2k-Modules of the Oroboros O2k. It can be added to an existing Oroboros O2k of any O2k-Series. This application does not require an additional ISS-Integrated Suction System and O2k-Titration Set. Furthermore, the OroboPOS-Mounting Tool of the OroboPOS Service Tools can be used from the available O2k and is not included. | |
| Power O2k-Respirometer | The Power O2k-Respirometer is an economical option for using additional O2k-Units to increase output in high-resolution respirometry. | |
| Proton leak | Flux of protons driven by the protonmotive force across the inner mt-membrane, bypassing the ATP synthase and thus contributing to LEAK respiration. Proton leak-flux depends non-linearly (non-ohmic) on the protonmotive force. Compare: Proton slip. | |
| Proton pump | Mitochondrial proton pumps are large enzyme complexes (CI, CIII, CIV, CV) spanning the inner mt-membrane, partially encoded by mtDNA. CI, CIII and CIV are proton pumps that drive protons against the electrochemical protonmotive force, driven by electron transfer from reduced substrates to oxygen. In contrast, ATP synthase (also known as CIV) is a proton pump that utilizes the energy of proton flow along the protonmotive force to drive phosphorylation of ADP to ATP. | |
| Proton slip | Proton slip is a property of the proton pumps (Complexes CI, CIII, and CIV) when the proton slips back to the matrix side within the proton pumping process. Slip is different from the proton leak, which depends on Δp and is a property of the inner mt-membrane (including the boundaries between membrane-spanning proteins and the lipid phase). Slip is an uncoupling process that depends mainly on flux and contributes to a reduction in the biochemical coupling efficiency of ATP production and oxygen consumption. Together with proton leak and cation cycling, proton slip is compensated for by LEAK respiration or LEAK oxygen flux, L. Compare: Proton leak. | |
| Q calibration - DatLab | Q calibration | |
| Q-junction | The Q-junction is a junction for convergent electron flow in the Electron transfer pathway (ET-pathway) from type N substrates and mt-matrix dehydrogenases through Complex I (CI), from type F substrates and FA oxidation through electron-transferring flavoprotein Complex (CETF), from succinate (S) through Complex II (CII), from glycerophosphate (Gp) through glycerophosphate dehydrogenase Complex (CGpDH), from choline through choline dehydrogenase, from dihydro-orotate through dihydro-orotate dehydrogenase, and other enzyme Complexes into the Q-cycle (ubiquinol/ubiquinone), and further downstream to Complex III (CIII) and Complex IV (CIV). The concept of the Q-junction, with the N-junction and F-junction upstream, provides the rationale for defining Electron-transfer-pathway states and categories of SUIT protocols. | |
| ROUTINE respiration | R | |
| Respiratory acceptor control ratio | RCR | The respiratory acceptor control ratio (RCR) is defined as State 3/State 4 [1]. If State 3 is measured at saturating [ADP], RCR is the inverse of the OXPHOS control ratio, L/P (when State 3 is equivalent to the OXPHOS state, P). RCR is directly but non-linearly related to the P-L control efficiency, jP-L = 1-L/P, with boundaries from 0.0 to 1.0. In contrast, RCR ranges from 1.0 to infinity, which needs to be considered when performing statistical analyses. In living cells, the term RCR has been used for the ratio State 3u/State 4o, i.e. for the inverse L/E ratio [2,3]. Then for conceptual and statistical reasons, RCR should be replaced by the E-L coupling efficiency, 1-L/E [4]. |
| Respiratory chain | RC | The mitochondrial respiratory chain (RC) consists of enzyme complexes arranged to form a metabolic system of convergent pathways for oxidative phosphorylation. In a general sense, the RC includes (1) the electron transfer pathway (ET-pathway), with transporters for the exchange of reduced substrates across the inner mitochondrial membrane, enzymes in the matrix space (particularly dehydrogenases of the tricarboxylic acid cycle), inner membrane-bound electron transfer complexes, and (2) the inner membrane-bound enzymes of the phosphorylation system. |
| Respiratory complexes | CI, CII, CIII, CIV, CETF, CGpDH, .. | Respiratory Complexes are membrane-bound enzymes consisting of several subunits which are involved in energy transduction of the respiratory system. » MiPNet article |
| Respiratory state | Respiratory states of mitochondrial preparations and living cells are defined in the current literature in many ways and with a diversity of terms. Mitochondrial respiratory states must be defined in terms of both, the coupling-control state and the electron-transfer-pathway state. | |
| Respirometry | Respirometry is the quantitative measurement of respiration. Respiration is therefore a combustion, a very slow one to be precise (Lavoisier and Laplace 1783). Thus the basic idea of using calorimetry to explore the sources and dynamics of heat changes were present in the origins of bioenergetics (Gnaiger 1983). Respirometry provides an indirect calorimetric approach to the measurement of metabolic heat changes, by measuring oxygen uptake (and carbon dioxide production and nitrogen excretion in the form of ammonia, urea, or uric acid) and converting the oxygen consumed into an enthalpy change, using the oxycaloric equivalent. Liebig (1842) showed that the substrate of oxidative respiration was protein, carbohydrates, and fat. The sum of these chemical changes of materials under the influence of living cells is known as metabolism (Lusk 1928). The amount (volume STP) of carbon dioxide expired to the amount (volume STP) of oxygen inspired simultaneously is the respiratory quotient, which is 1.0 for the combustion of carbohydrate, but less for lipid and protein. Voit (1901) summarized early respirometric studies carried out by the Munich school on patients and healthy controls, concluding that the metabolism in the body was not proportional to the combustibility of the substances outside the body, but that protein, which burns with difficulty outside, metabolizes with the greatest ease, then carbohydrates, while fats, which readily burns outside, is the most difficultly combustible in the organism. Extending these conclusions on the sources of metabolic heat changes, the corresponding dynamics or respiratory control was summarized (Lusk 1928): The absorption of oxygen does not cause metabolism, but rather the amount of the metabolism determines the amount of oxygen to be absorbed. .. metabolism regulates the respiration. | |
| STPD | STPD | At standard temperature and pressure dry (STPD: 0 °C = 273.15 K and 1 atm = 101.325 kPa = 760 mmHg), the molar volume of an ideal gas, Vm, and Vm,O2 is 22.414 and 22.392 L∙mol-1, respectively. Rounded to three decimal places, both values yield the conversion factor of 0.744 from units used in spiroergometry (VO2max [mL O2·min-1]) to SI units [µmol O2·s-1]. For comparison at normal temperature and pressure dry (NTPD: 20 °C), Vm,O2 is 24.038 L∙mol-1. Note that the SI standard pressure is 100 kPa, which corresponds to the standard molar volume of an ideal gas of 22.711 L∙mol-1 and 22.689 L∙mol-1 for O2. |
| SUIT | SUIT | SUIT is the abbreviation for Substrate-Uncoupler-Inhibitor Titration. SUIT protocols are used with mt-preparations to study respiratory control in a sequence of coupling and pathway control states induced by multiple titrations within a single experimental assay. These studies use biological samples economically to gain maximum information with a minimum amount of cells or tissue. |
| SUIT-001 | RP1 | 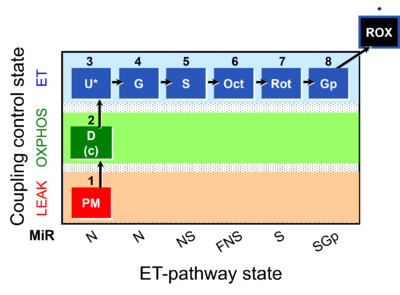 |
| SUIT-001 O2 ce-pce D003 | RP1 ce-pce | 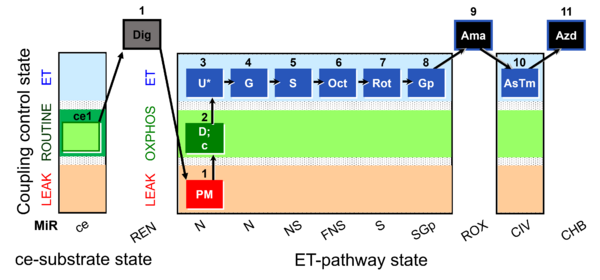 |
| SUIT-001 O2 ce-pce D004 | RP1 ce-pce blood | 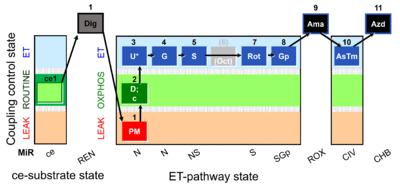 |
| SUIT-001 O2 mt D001 | RP1 mt | 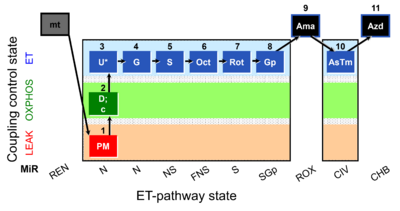 |
| SUIT-001 O2 pfi D002 | RP1 pfi | 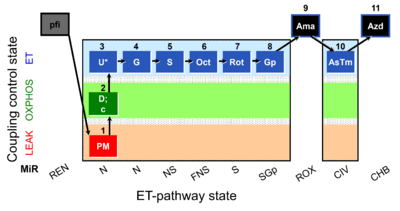 |
| SUIT-002 | RP2 | 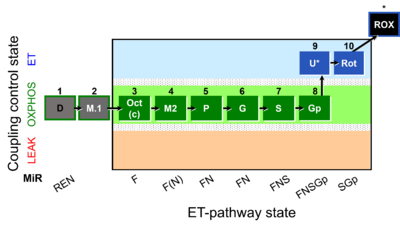 |
| SUIT-002 O2 ce-pce D007 | RP2 ce-pce | 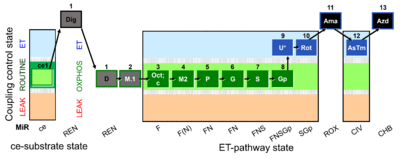 |
| SUIT-002 O2 ce-pce D007a | RP2 ce-pce blood |  |
| SUIT-002 O2 mt D005 | RP2 mt | 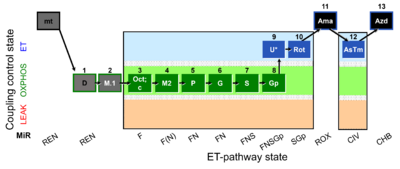 |
| SUIT-002 O2 pfi D006 | RP2 pfi | 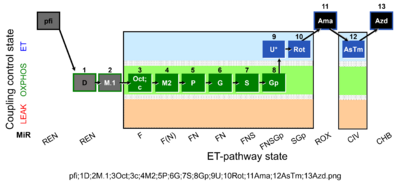 |
| SUIT-003 | CCP-ce | 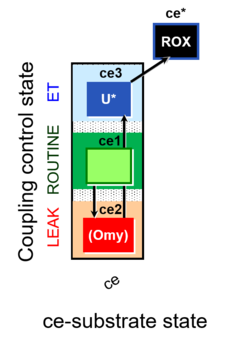 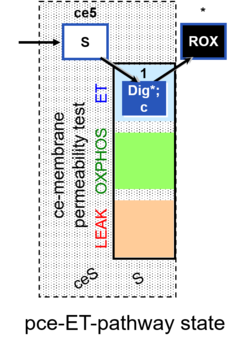 |
| SUIT-003 AmR ce D058 | AmR effect on ce | 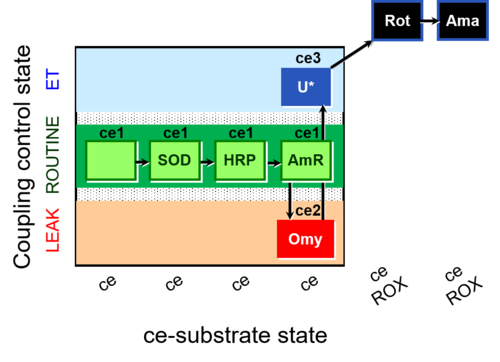 |
| SUIT-003 AmR ce D059 | AmR effect on ce - control | 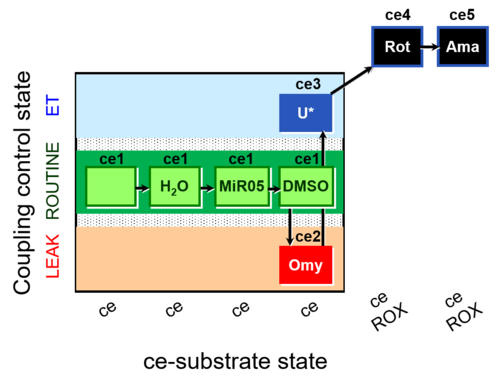 |
| SUIT-003 Ce1;ce1P;ce3U;ce4Glc;ce5M;ce6Rot;ce7S;1Dig;1c;2Ama;3AsTm;4Azd | cePMGlc,S | 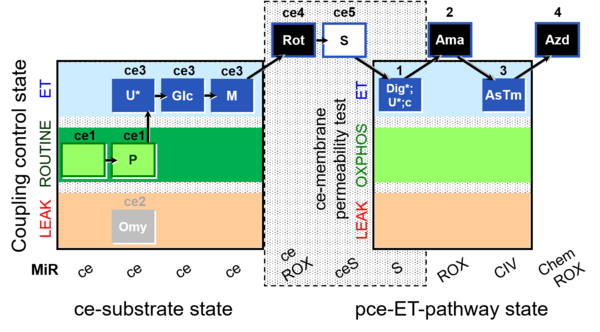 |
| SUIT-003 Ce1;ce2U- | ce | 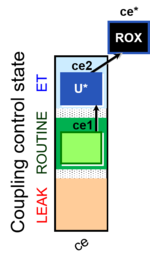 |
| SUIT-003 Ce1;ce3U- | ce | 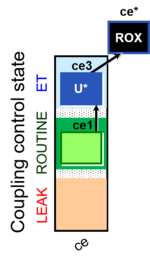 |
| SUIT-003 O2 ce D009 | CCP-ce short | 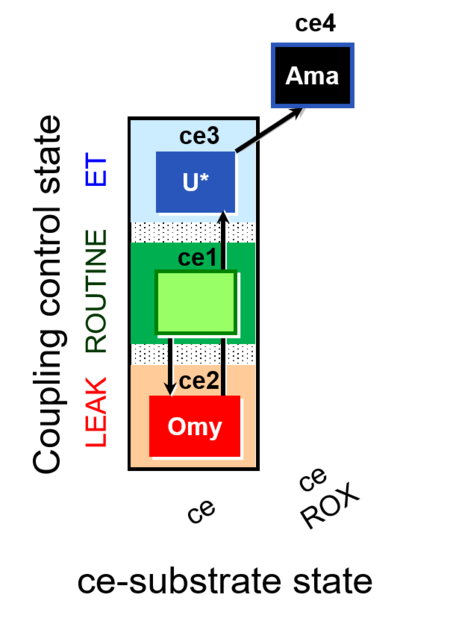 |
| SUIT-003 O2 ce D012 | CCP-ce(P) | 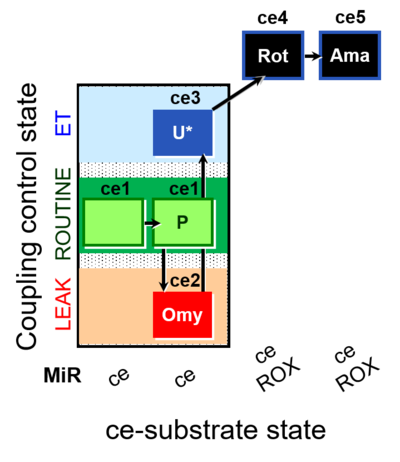 |
| SUIT-003 O2 ce D028 | CCP-ce S permeability test | 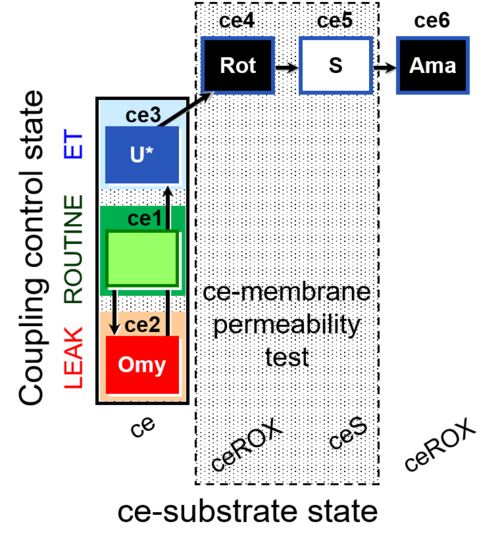 |
| SUIT-003 O2 ce D037 | CCP-ce Crabtree_R | 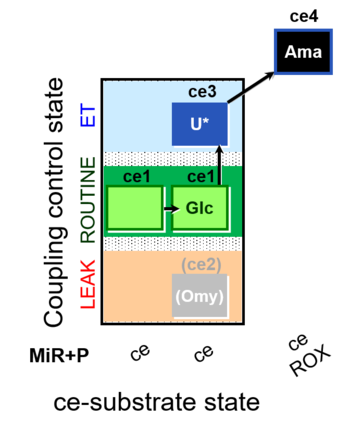 |
| SUIT-003 O2 ce D038 | CCP-ce Crabtree_E | 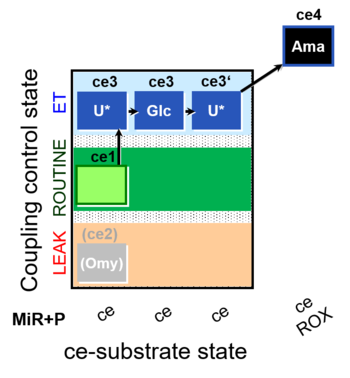 |
| SUIT-003 O2 ce D039 | CCP-ce microalgae | 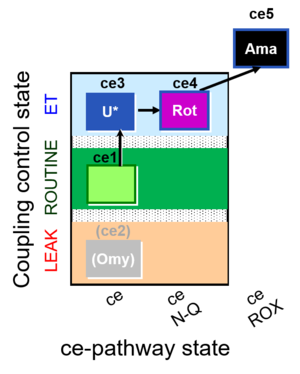 |
| SUIT-003 O2 ce D050 | CCP-ce Snv | 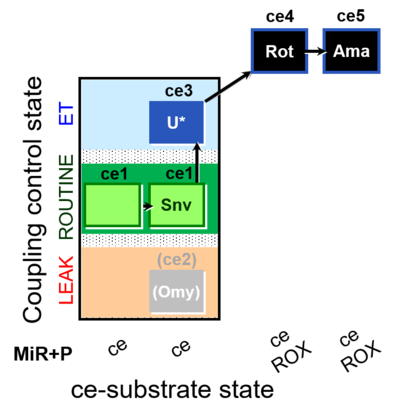 |
| SUIT-003 O2 ce D060 | CCP-ce Snv,Mnanv | 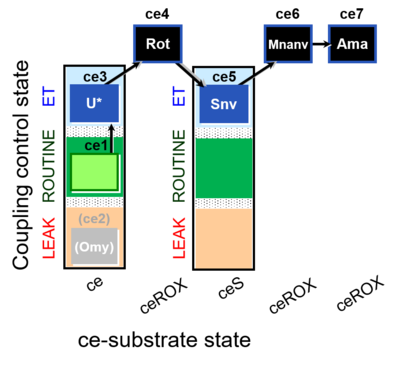 |
| SUIT-003 O2 ce D061 | CCP-ce Snv,Mnanv - control | 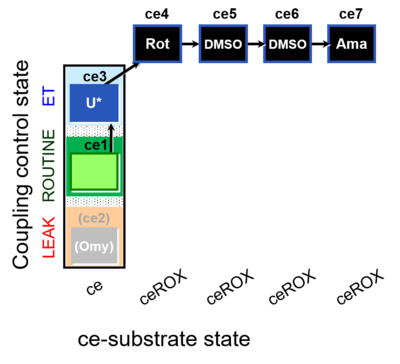 |
| SUIT-003 O2 ce D062 | CCP-ce Snv - control | 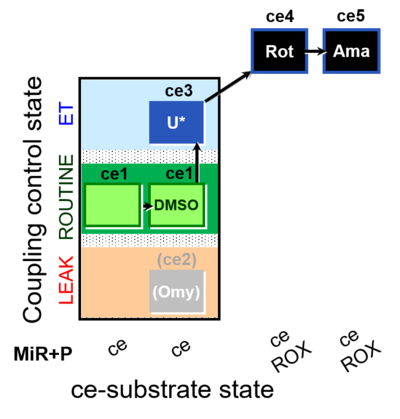 |
| SUIT-003 O2 ce-pce D013 | CCVP-Glc,M | 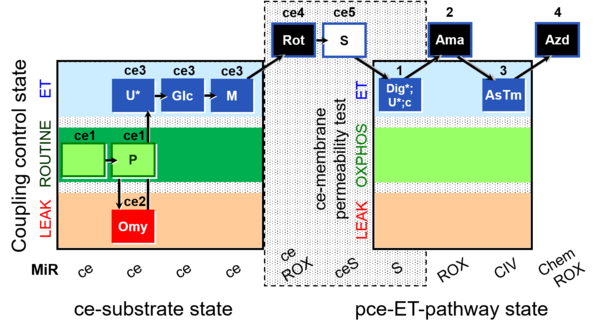 |
| SUIT-003 O2 ce-pce D018 | CCVP-Glc | 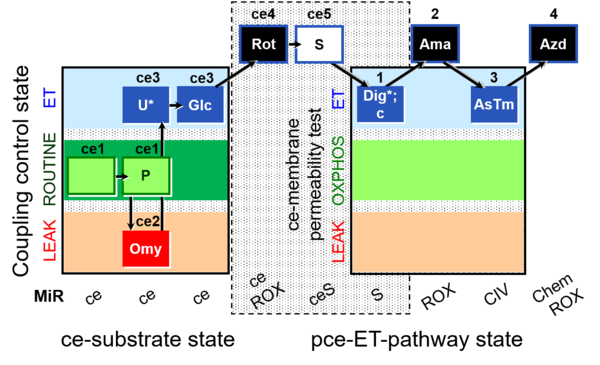 |
| SUIT-003 O2 ce-pce D020 | CCVP | 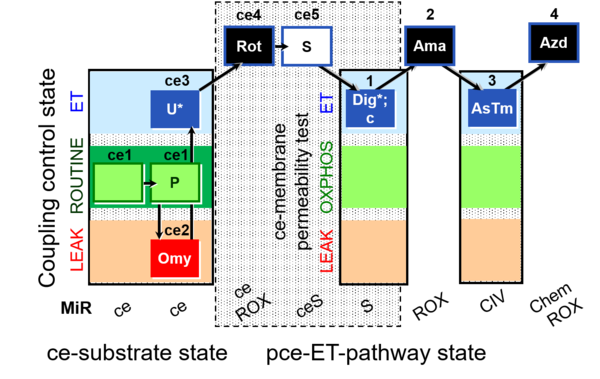 |
| SUIT-003 pH ce D067 | CCP-Crabtree with glycolysis inhibition | 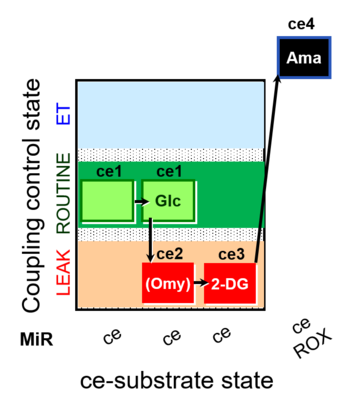 |
| SUIT-004 | RP1-short | 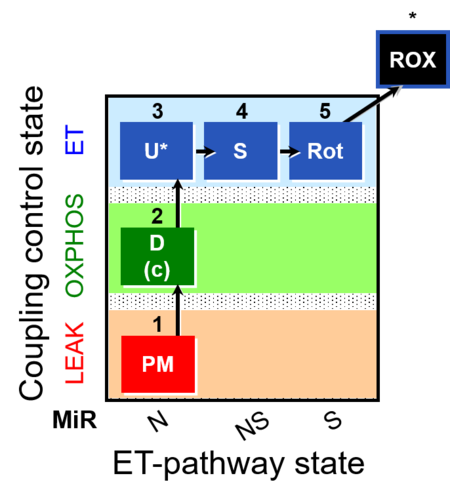 |
| SUIT-004 O2 pfi D010 | RP1-short pfi | 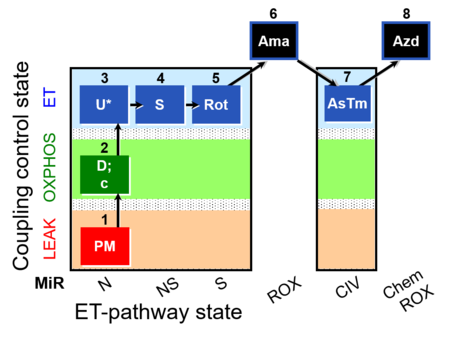 |
| SUIT-005 | RP2-short | 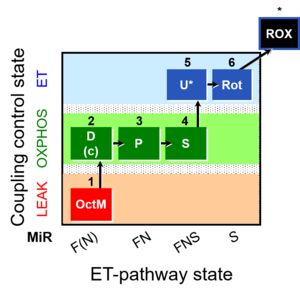 |
| SUIT-005 O2 pfi D011 | RP2-short pfi | 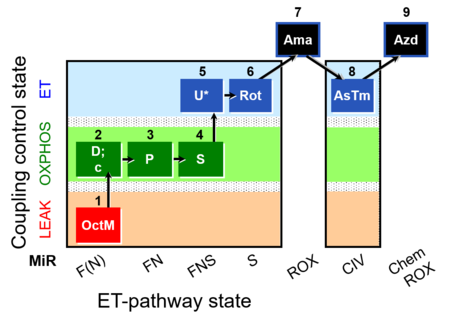 |
| SUIT-006 | CCP-mtprep | 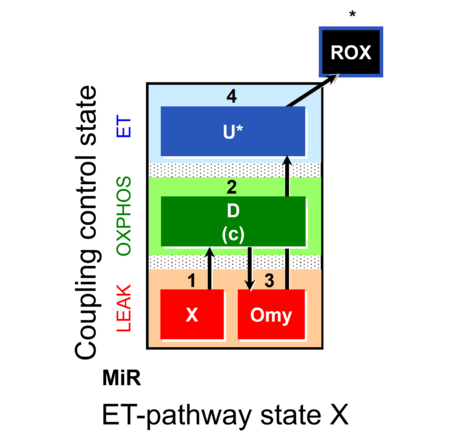 |
| SUIT-006 O2 ce-pce D029 | CCP ce-pce PM | 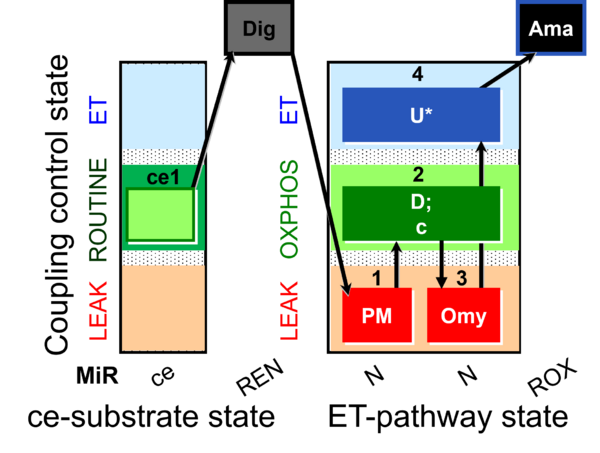 |
| SUIT-006 O2 mt D022 | CCP mt S(Rot) | 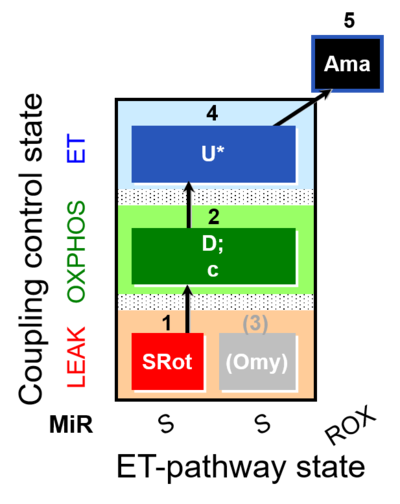 |
| SUIT-006 O2 mt D047 | CCP mt PM | 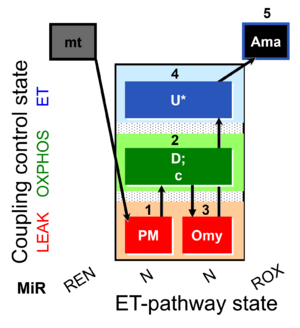 |
| SUIT-006 Q ce-pce D073 | CCP ce-pce S(Rot) | 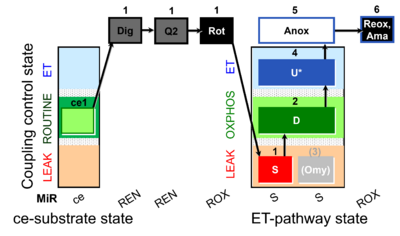 |
| SUIT-006 Q mt D071 | CCP mt S(Rot) | 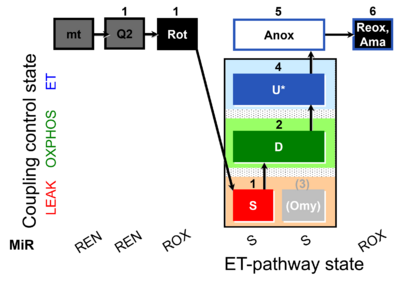 |
| SUIT-007 | Glutamate anaplerosis | 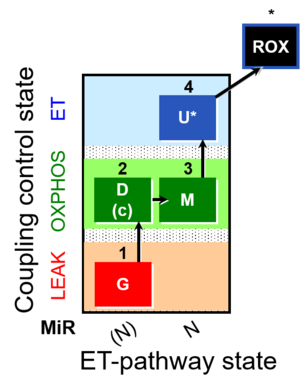 |
| SUIT-007 O2 ce-pce D030 | Glutamate anaplerotic pathway | 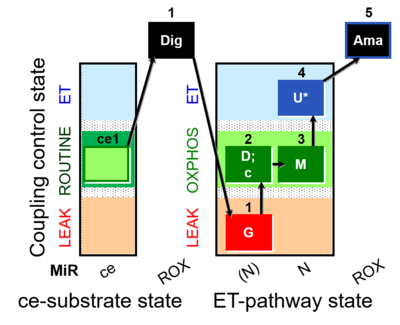 |
| SUIT-008 | PM+G+S_OXPHOS+Rot_ET | 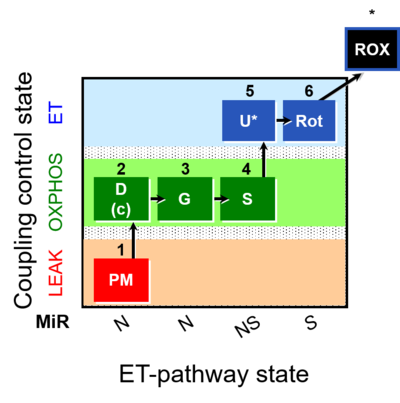 |
| SUIT-008 O2 ce-pce D025 | Q-junction ce-pce | 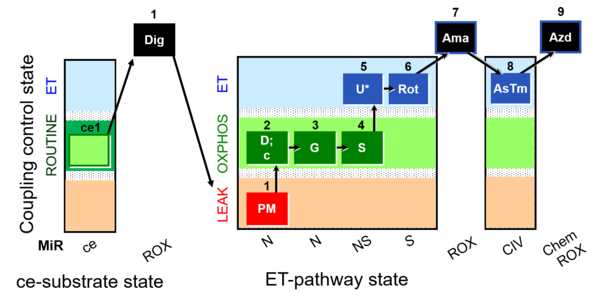 |
| SUIT-008 O2 mt D026 | Q-junction mtprep | 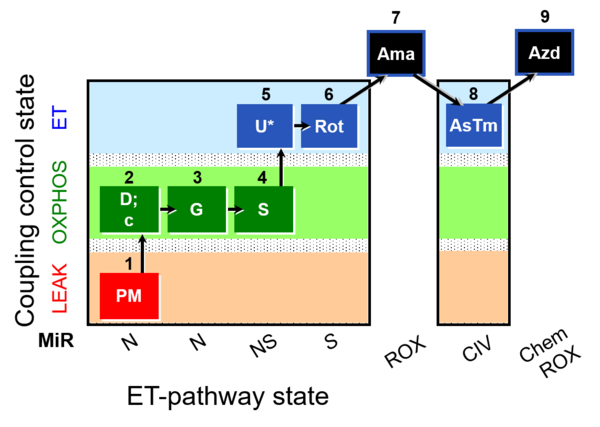 |
| SUIT-008 O2 pce D25 | NS(PGM) | 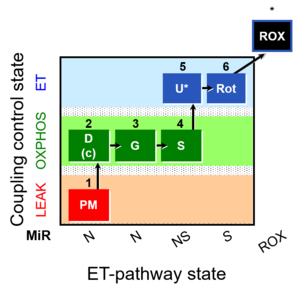 |
| SUIT-008 O2 pfi D014 | 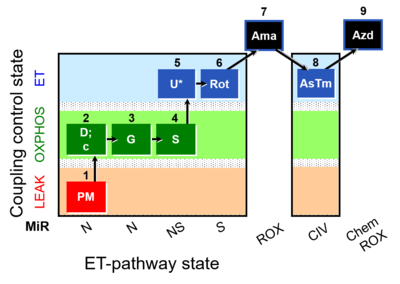 | |
| SUIT-009 O2 ce-pce D016 | 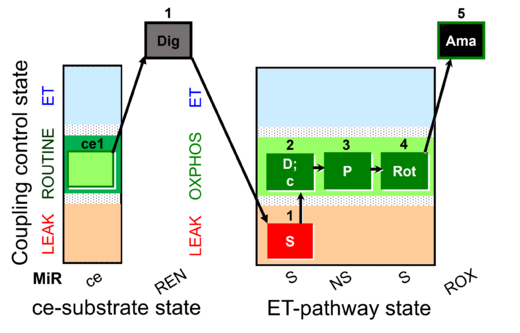 | |
| SUIT-009 O2 mt D015 | 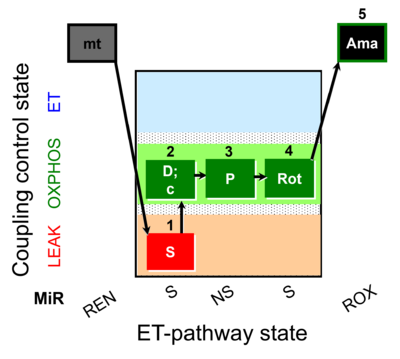 | |
| SUIT-010 | Digitonin test | 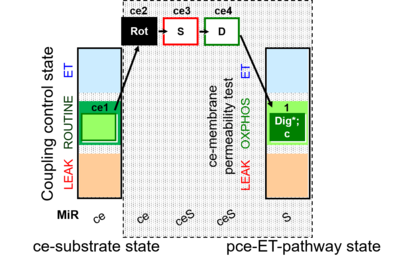 |
| SUIT-010 O2 ce-pce D008 | Dig titration-pce |  |
| SUIT-011 | GM+S_OXPHOS+Rot_ET | 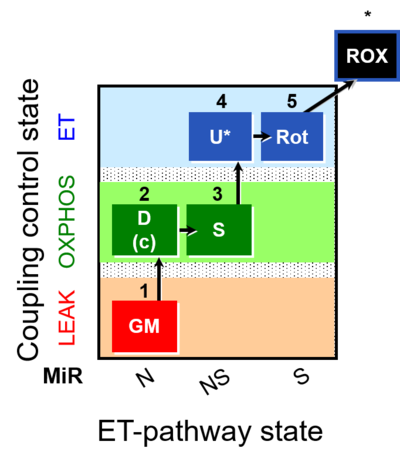 |
| SUIT-011 O2 pfi D024 | NS physiological maximum capapcity in fibres | 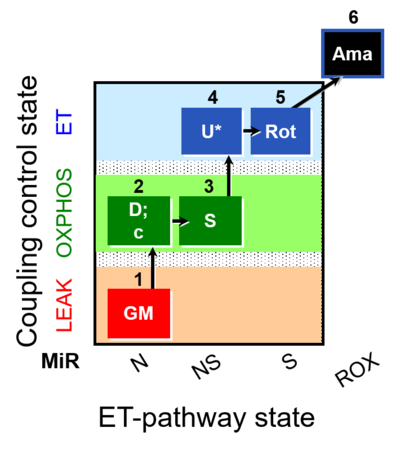 |
| SUIT-012 | PM+G_OXPHOS | 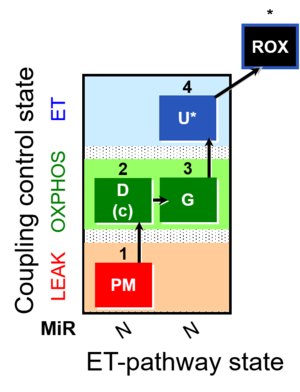 |
| SUIT-012 O2 ce-pce D052 | N(PGM) | 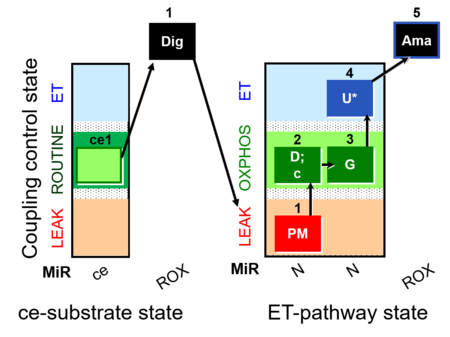 |
| SUIT-012 O2 mt D027 | N CCP mtprep | 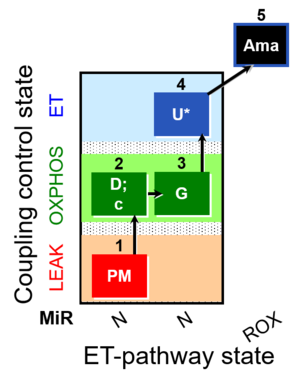 |
| SUIT-013 AmR ce D023 | O2 dependence of H2O2 production ce | 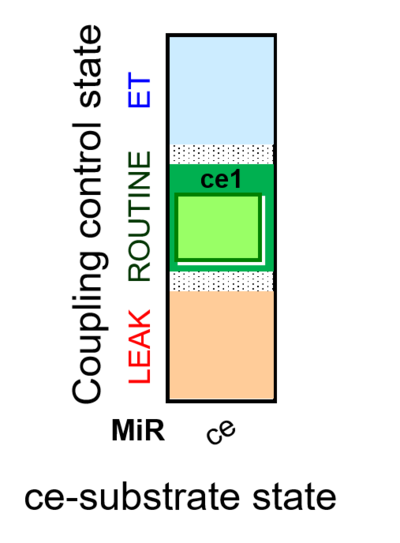 |
| SUIT-014 | GM+P+S_OXPHOS+Rot_ET | 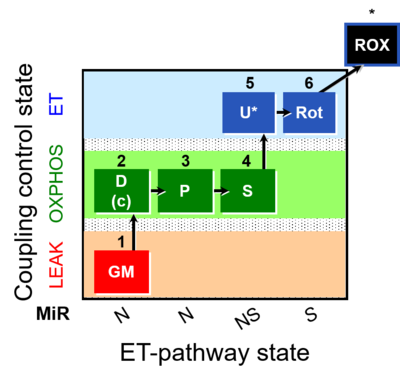 |
| SUIT-014 O2 pfi D042 | NS(PGM) | 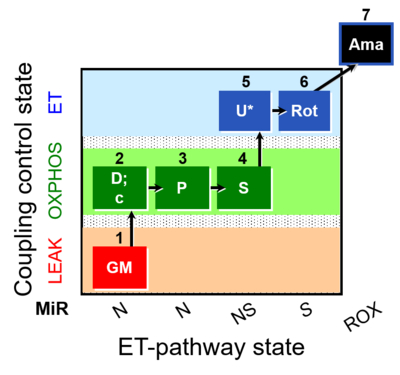 |
| SUIT-015 | F+G+P+S_OXPHOS+Rot_ET | 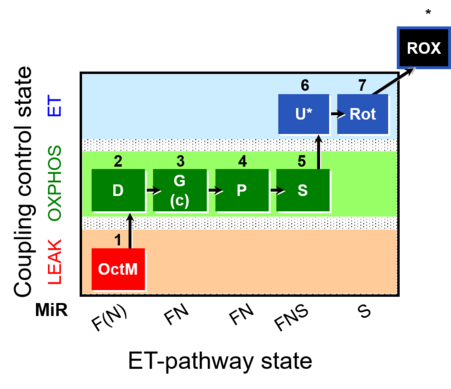 |
| SUIT-015 O2 pti D043 | FNS(Oct,PGM) | 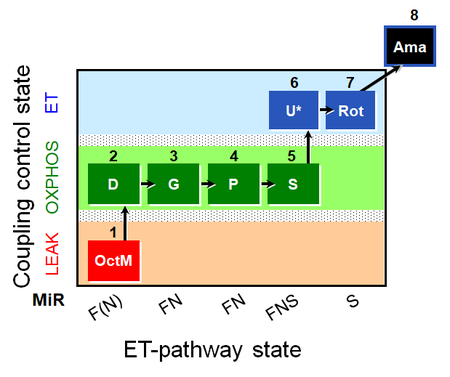 |
| SUIT-016 | F+G+S+Rot_OXPHOS+Omy | 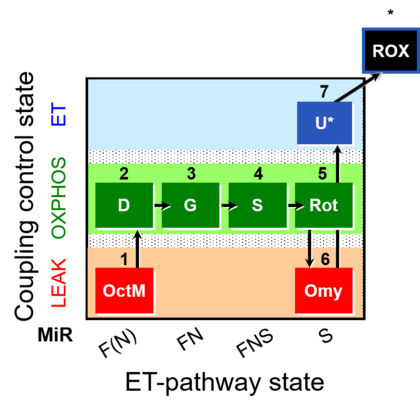 |
| SUIT-016 O2 pfi D044 | FNS(Oct,GM) | 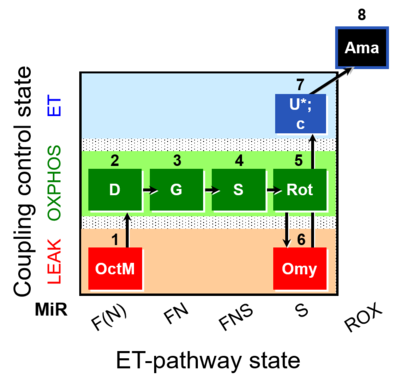 |
| SUIT-017 | F+G+S_OXPHOS+Rot_ET | 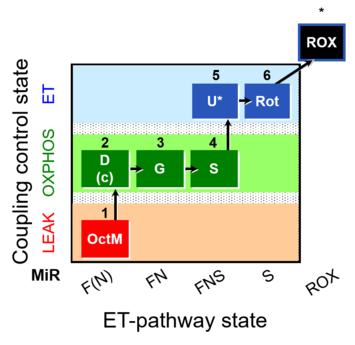 |
| SUIT-017 O2 mt D046 | FNS(Oct,GM) | 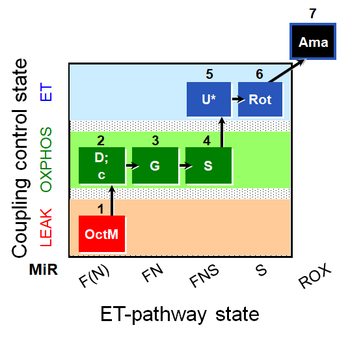 |
| SUIT-017 O2 pfi D049 | FNS(Oct,GM) |  |
| SUIT-018 O2 mt D054 | 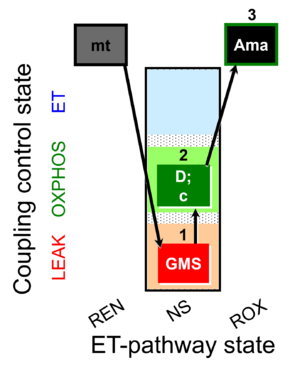 | |
| SUIT-019 | Pal+Oct+P+G_OXPHOS+S+Rot_ET | 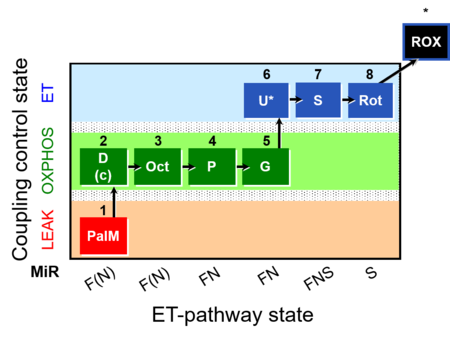 |
| SUIT-019 O2 pfi D045 | FNS(PalOct,PGM) | 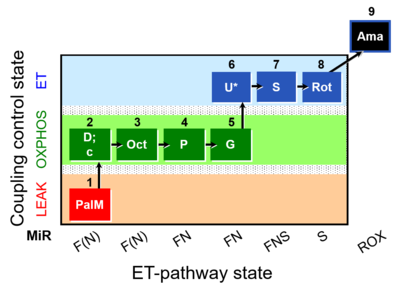 |
| SUIT-020 | PM+G+S+Rot_OXPHOS+Omy | 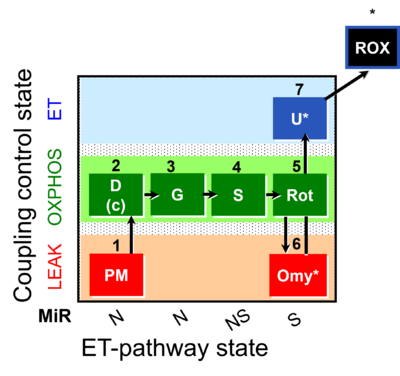 |
| SUIT-020 O2 mt D032 | Q-junction additivity and respiratory control for membrane potential | 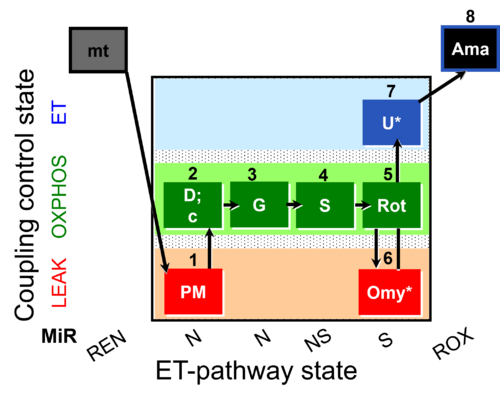 |
| SUIT-021 | OXPHOS (GM+S+Rot+Omy) | 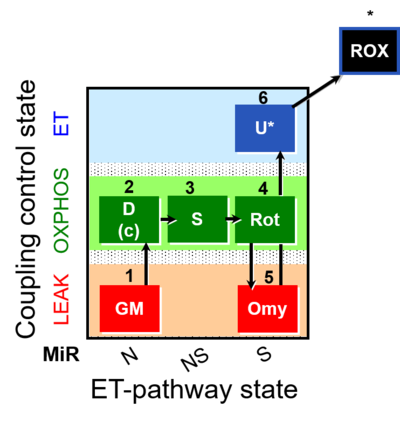 |
| SUIT-021 O2 mt D035 | NS(GM) | 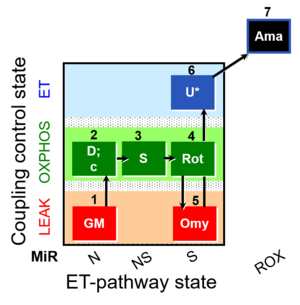 |
| SUIT-022 | AOX (ce CN+SHAM) | 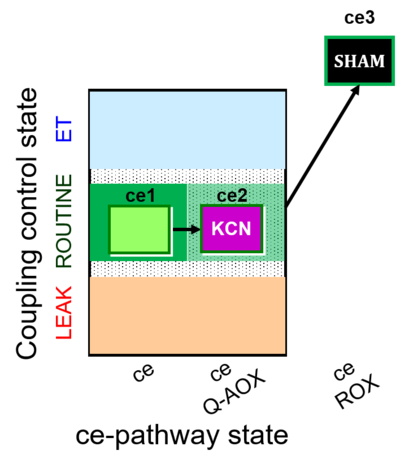 |
| SUIT-022 O2 ce D051 | AOX-ce CN+SHAM | 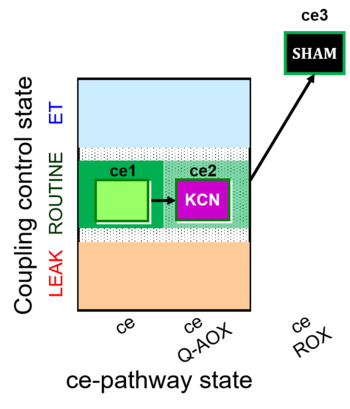 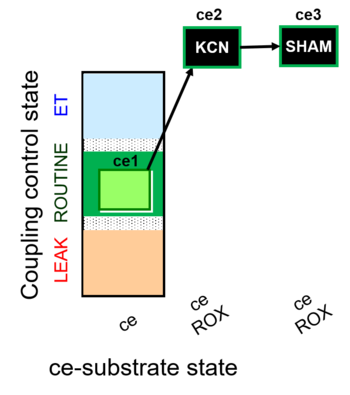 |
| SUIT-023 | AOX-ce SHAM+CN | 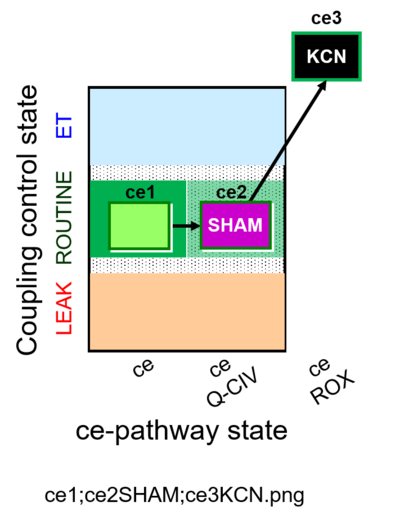 |
| SUIT-023 O2 ce D053 | AOX-ce SHAM+CN | 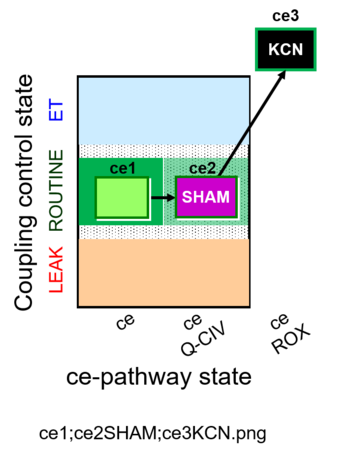 |
| SUIT-024 | ATPase (PM) | 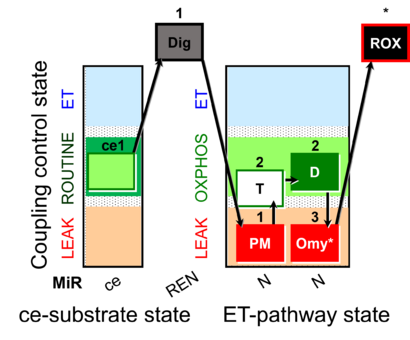 |
| SUIT-024 O2 ce-pce D056 | N(PM) | 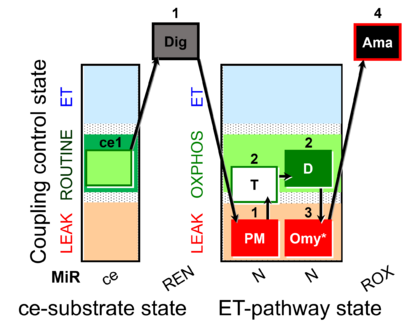 |
| SUIT-025 | OXPHOS (F+M+P+G+S+Rot) | 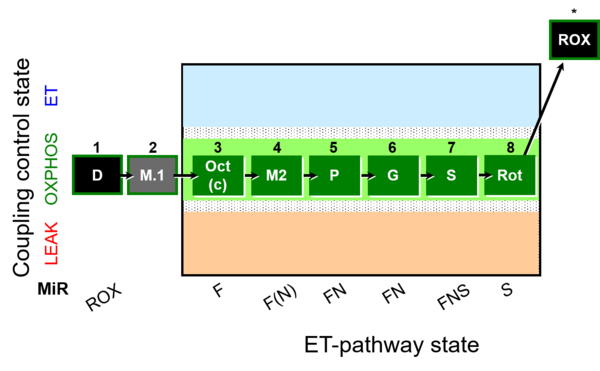 |
| SUIT-025 O2 mt D057 | FNS(Oct,PGM) | 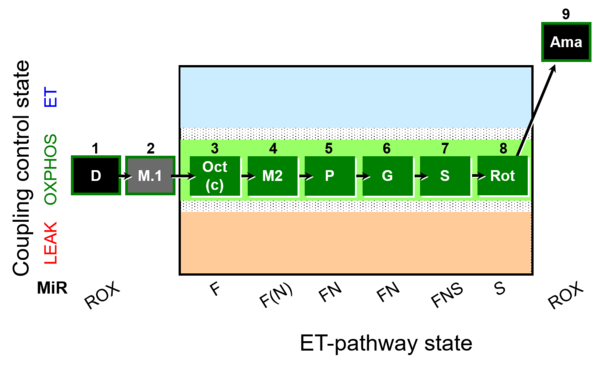 |
| SUIT-027 | Malate anaplerosis | 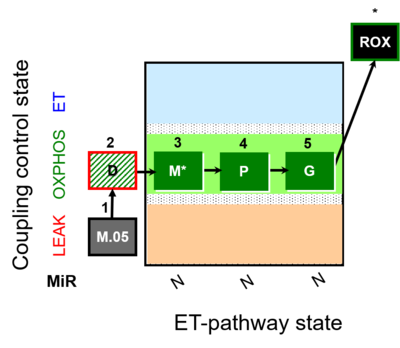 |
| SUIT-029 O2 mt D066 | QC_imt_PM_T+OXPHOS+c+Omy_ET_G+S+Rot | 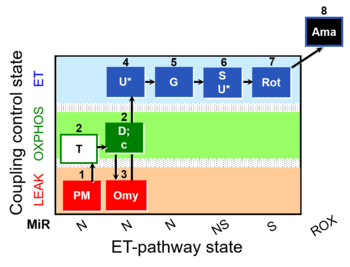 |
| SUIT-031 | PM+S+Rot | 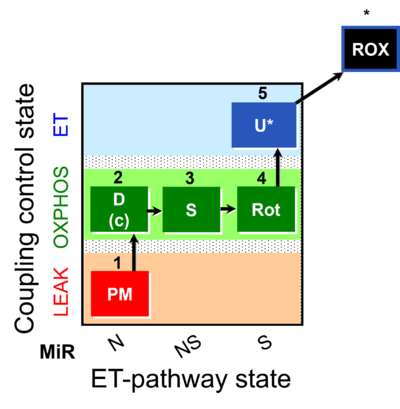 |
| SUIT-031 O2 ce-pce D079 | PM+S+Rot | 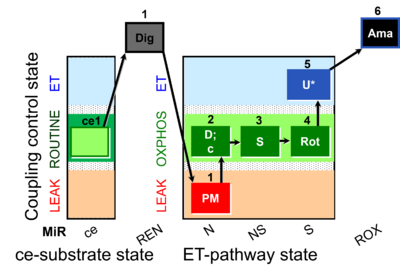 |
| SUIT-031 O2 mt D075 | PM+S+Rot | 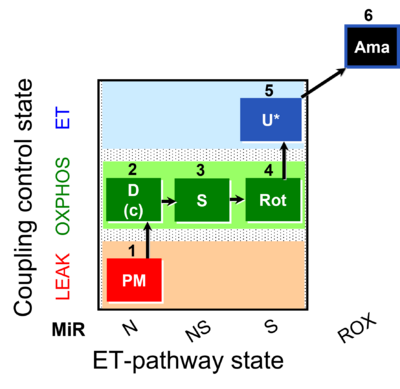 |
| SUIT-031 Q ce-pce D074 | PM+S+Rot | 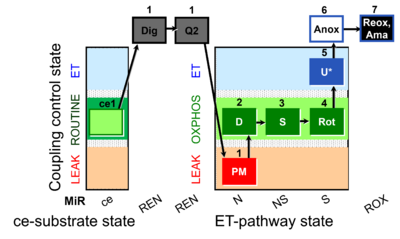 |
| SUIT-031 Q mt D072 | PM+S+Rot | 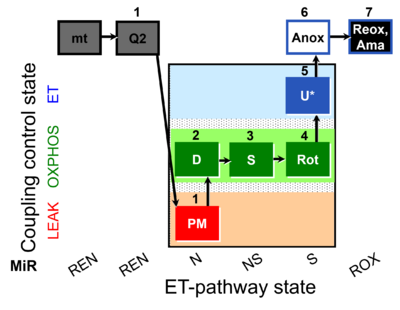 |
| SUITbrowser | Use the SUITbrowser to find the substrate-uncoupler-inhibitor-titration (SUIT) protocol most suitable for addressing your research questions.
Open the SUITbrowser: http://suitbrowser.oroboros.at/
 How to find a DL-Protocol (DLP) How to find a DL-Protocol (DLP) | |
| Select O2k - DatLab | Select O2k - DatLab | |
| Selectivity | Selectivity is the ability of a sensor or method to quantify accurately and specifically the analyte or analytes in the presence of other compounds. | |
| Sensitivity | Sensitivity refers to the response obtained for a given amount of analyte and is often denoted by two factors: the limit of detection and the limit of quantification. | |
| Smoothing | Various methods of smoothing can be applied to improve the signal-to-noise ratio. For instance, data points recorded over time [s] or over a range of wavelengths [nm] can be smoothed by averaging n data points per interval. Then the average of the n points per smoothing interval can be taken for each successively recorded data point across the time range or range of the spectrum to give a n-point moving average smoothing. This method decreases the noise of the signal, but clearly reduces the time or wavelength resolution. More advanced methods of smoothing are applied to retain a higher time resolution or wavelength resolution. | |
| Stability | Stability determines the accuracy of intensity and absorbance measurements as a function of time. Instability (see drift introduces systematic errors in the accuracy of fluorescence and absorbance measurements. | |
| Startup O2k-Respirometer | Startup O2k-Respirometer - the experimental system complete for basic high-resolution respirometry (HRR). The O2k-Respirometer includes the O2k-Main Unit with stainless steel housing, O2k-Assembly Kit, two OroboPOS (polarographic oxygen sensors) and OroboPOS-Service Kit, DatLab software, the ISS-Integrated Suction System, the O2k-Titration Set, and for performing high-resolution respirometry with reduced amounts of biological sample the O2k-sV-Module.
| |
| Steady state | A system is in a steady state if the state variables of a dynamic system do not change over time due to exchange processes with the environment, which compensate for internal dissipative transformations — such as chemical reactions or diffusion — and thus prevent any changes of the system and externalize dissipative changes to the environment. The dynamic nature of the steady state differentiates it from the thermodynamic equilibrium state. {Quote} Steady states can be obtained only in open systems, in which changes by internal transformations, e.g., O2 consumption, are instantaneously compensated for by external fluxes across the system boundary, e.g., O2 supply, thus preventing a change of O2 concentration in the system (Gnaiger 1993). Mitochondrial respiratory states monitored in closed systems satisfy the criteria of pseudo-steady states for limited periods of time, when changes in the system (concentrations of O2, fuel substrates, ADP, Pi, H+) do not exert significant effects on metabolic fluxes (respiration, phosphorylation). Such pseudo-steady states require respiratory media with sufficient buffering capacity and substrates maintained at kinetically-saturating concentrations, and thus depend on the kinetics of the processes under investigation. {end of Quote: BEC 2020.1}. Whereas fluxes may change at a steady state over time, concentrations are maintained constant. The 'respiratory steady state' (Chance and Williams 1955) is characterized by constant fluxes (O2 flux, H2O2 flux) and measured variables of state (cytochrome redox states, Q redox state, NADH redox state, mitochondrial membrane potential). High-resolution respirometry allows for the measurement of several parameters (e.g. O2 flux, H2O2 flux, mitochondrial membrane potential) at pseudo-steady states, when changes of concentrations in the closed system do not exert any control on fluxes. Combination with the Titration-Injection microPump (TIP2k) allows operation with programmable titration regimes at steady-state ADP concentration (Gnaiger 2001), oxygen concentration (oxystat mode; Gnaiger et al 2000, Harrison et al 2015) or steady-state pH (pH-stat more), yielding an expanded flexibility in experimental design by combining the technical advantages of closed and open systems approaches. | |
| Substrate control state | See Electron-transfer-pathway state | |
| Substrate-uncoupler-inhibitor titration | SUIT | Mitochondrial Substrate-uncoupler-inhibitor titration (SUIT) protocols are used with mitochondrial preparations to study respiratory control in a sequence of coupling and substrates states induced by multiple titrations within a single experimental assay. |
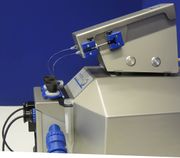
| TIP2k-Module | TIP2k-Module - Titration-Injection microPump (TIP2k) for two-channel operation with the O2k-FluoRespirometer with automatic control by DatLab of programmable titration regimes and feedback control (oxystat, pH-stat). | |
| TPP+ inhibitory effect | A major task in establishing a procedure for measurement of mitochondrial membrane potential using probe molecules is the evaluation of inhibitory concentrations of the probe molecule on the activity of respiration. The TPP+ inhibitory effect (this also applies to TPMP+ and other indicator molecules) is frequently ignored. Accurate knowledge of a threshold concentration is required to evaluate the necessary limit of detection of TPP+, and for restriction of experimental TPP+ concentrations below the inhibitory range. | |
| Taurine | Taurine, or 2-Aminoethan sulfonic acid, is one of the most abundant low-molecular-weight organic constituents in animals and humans. It has a multitude of functions in different types of tissue, one of which is the stabilization of membranes. Because of this and its antioxidative effect, taurine is a component of the respiration media MiR05 and MiR06 to preserve mitochondrial function. | |
| Tetraphenylphosphonium | TPP+ | Tetraphenylphosphonium (TPP+). A lipophilic molecular probe in conjunction with an ion selective electrode (ISE) for measuring the mitochondrial membrane potential. |
| Time resolution | Time resolution in respirometric measurements is influenced by three parameters: the response time of the POS, the data sampling interval and the number of points used for flux calculation. | |
| Uncoupler titrations | In uncoupler titrations various uncouplers, such as CCCP, FCCP or DNP are applied to uncouple mitochondrial electron transfer from phosphorylation (ATP synthase, ANT and phosphate carrier), particularly with the aim to measure ET capacity. ET capacity is maximum oxygen flux measured as noncoupled respiration with optimum uncoupler concentration. | |
| Uncoupling-control ratio | UCR | The uncoupling-control ratio UCR is the ratio of ET-pathway/ROUTINE-respiration (E/R) in living cells, evaluated by careful uncoupler titrations (Steinlechner et al 1996). Compare ROUTINE-control ratio (R/E) (Gnaiger 2008). |
| Unspecific binding of TPP+ | Unspecific binding of the probe molecule TPP+ in the matrix phase of mitochondria is taken into account as a correction for measurement of the mitochondrial membrane potential. External unspecific binding is the binding outside of the inner mt-membrane or on the outer side of the inner mt-membrane, in contrast to internal unspecific binding. | |
| VO2max | VO2max; VO2max/M | Maximum oxygen consumption, VO2max, is and index of cardiorespiratory fitness, measured by spiroergometry on human and animal organisms capable of controlled physical exercise performance on a treadmill or cycle ergometer. VO2max is the maximum respiration of an organism, expressed as the volume of O2 at STPD consumed per unit of time per individual object [mL.min-1.x-1]. If normalized per body mass of the individual object, M [kg.x-1], mass specific maximum oxygen consumption, VO2max/M, is expressed in units [mL.min-1.kg-1]. |
| Warburg effect | Recently, controversies had a renaissance on the much neglected Crabtree effect (aerobic glycolysis in a large range of cells exposed to glucose or fructose, with fully functional mitochondria; Crabtree 1929; Gnaiger and Kemp 1990) versus the Warburg effect (loss of mitochondrial function inducing cancer and stimulating compensatory aerobic glycolysis in the presence of oxygen; Warburg 1956; see list of references for reviews). Today it is widely accepted that ‘the Warburg effect is not consistent across all cancer types’ (Potter et al 2016) and reprogramming of mitochondrial energy metabolism represents a functional adjustment of cancer cells (Schöpf et al 2020). | |
| Zero calibration | R0 | Zero calibration is, together with air calibration, one of the two steps of the POS calibration. It is performed in the closed chamber after all the oxygen has been depleted by the addition of dithionite or by respiration of imt or cells. Any incubation medium can be used for zero calibration with dithionite or sample. Unlike air calibration, it is not necessary to perform a zero calibration on each experimental day. After performing a zero calibration, it is recommended not running other experiments on the same day. Even after standard cleaning of the O2k-chambers, there might be residual amounts of reduced dithionite in the chamber, affecting the oxygen flux in subsequent experiments performed on the same day. |

